2024 Hualapai Valley Groundwater Basin Updated Forecast Report
Overview: This report provides an updated forecast for the future water levels and pumping capabilities of the Hualapai Valley Groundwater Basin, utilizing the Hualapai Valley Hydraulic Model (HVHM) developed by the U.S. Geological Survey (USGS). This forecast is based on current observed agricultural conditions and includes a comparison with the projections outlined in the 2021 Hualapai Valley Basin USGS Study (HVB Study). Detailed information about the HVHM and the Hualapai Valley Groundwater Basin can be found in the Hualapai Valley Basin USGS Study, available online at: https://pubs.usgs.gov/publication/sir20215077
Disclaimer: The analysis includes simulations of maximum well-pumping scenarios, with a focus on median trends and variability across multiple runs. Although specific well locations are required to run the HVHM, this forecast is not an exact site-specific forecast, rather a median scale. This forecast is meant to be used as a scientific estimate and in no way a guarantee. Model Input Details and Assumptions: There are certain details and risk conservative assumptions used to prepare the input information needed to run the model. Below is a list of them for this report.
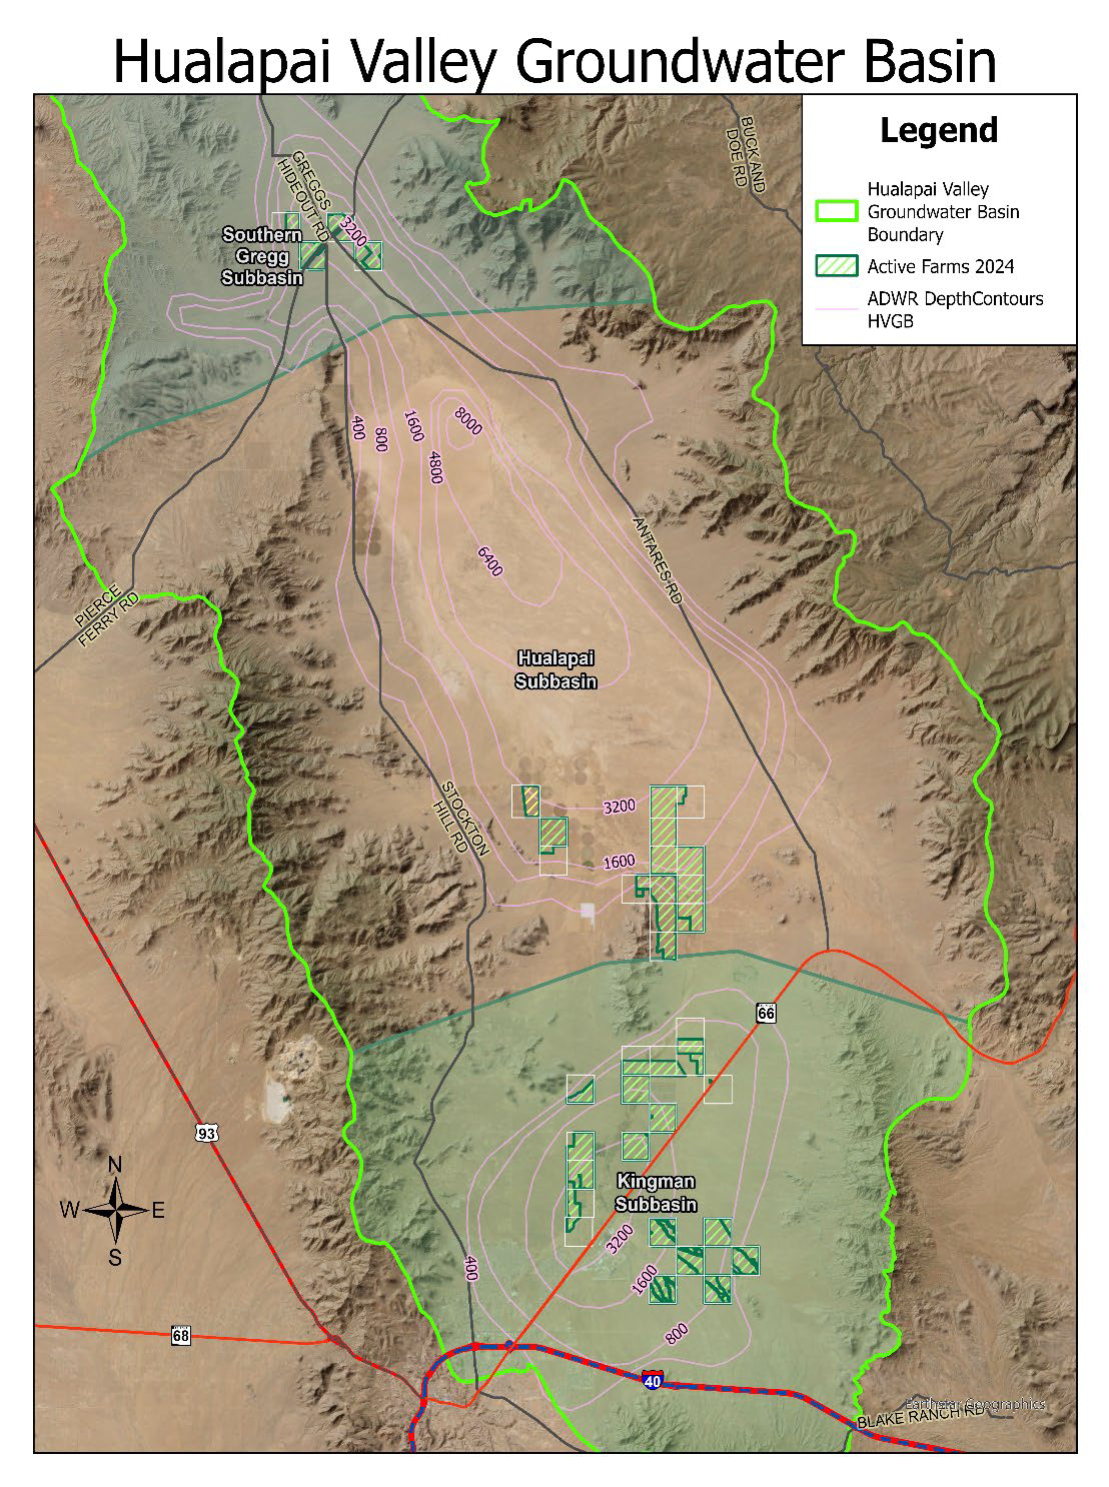
- Active farm observations were made in November 2024, with a total of 16,505 active farm acres observed in the Hualapai Valley Groundwater Basin.
- Exact agricultural well locations are not used, rather one well-site per section of active farmland.
- Well locations closer to the boundary of the basin do not simulate well due to the cells of the model drying up. The estimated pumping at those locations were added to well locations further from the boundary to provide more consistent long-term pumping results.
- Of the list of City of Kingman wells provided, only the wells that had pump data available through the Arizona Department of Water Resources (ADWR) was used in the HVHM. (6 wells out of 12 total).
- For the City of Kingman wells, an annual population growth percentage of 2.3% (per the World Population Review) was used for future year withdrawal rates.
- The USGS Orchard Tree water draw rate of 2.72 acre-feet per acre was used for the majority of cultivated acres in this forecast, which is an average of the Young Orchard Tree rate of 2.42 and Mature Orchard Tree rate of 3.02 acre-feet per acre. This rate was used to account for the mix between young and mature trees observed as well as the unknown of when trees are replaced through the extended estimation used in this model. 383 acres were identified as vine vegetation and 1.01 acre-feet per acre was used in the model for those acres, giving a total average of 2.68 acre-feet per acre.
- The HVHM uses 40 simulations to account for the uncertainty of the aquifer’s physical attributes.
- This forecast did not include the assumption of any on-farm percolation or recharge construction projects.
For a full list of Model Limitations and Assumptions for the HVHM, please see page 35 of the HVB Study referenced above.
Comparison Table
| 2021 Hualapai Valley Basin (HVB) USGS Study Report | 2024 HVB Updated Forecast Report | Difference | ||||||
| Subbasins | Cultivated Acres For 2019 | Water Demand Estimate In 2019 | Estimated Cultivated Acres For 2024 | Water Demand Estimate In 2024 | Subbasins | Observed Cultivate Acres | Estimated Water Demand | Difference Of 2024 Water Demand Estimated In USGS Report And Current Forecast |
| Gregg Subbasin Farms (Farm 6 on Table of 2021 Report) | 584 | 1,080 | 640 | 1,728 | Gregg Subbasin Farms | 1,826 | 4,977 | 3,249 |
| Hualapai Subbasin Farms (Farms 1 & 2 on Table 4 of 2021 Report) | 12,192 | 22,550 | 23,378 | 63,120 | Hualapai Subbasin Farms | 6,543 | 17,144 | -45,976 |
| Kingman Subbasin Farms (Farms 3-7 on Table 4 of 2021 Report) | 1,314 | 2,430 | 5,260 | 14,202 | Kingman Subbasin Farms | 8,136 | 22,131 | 7,929 |
| 2021 Report Totals | 14,090 | 26,060 | 29,278 | 79,050 | 2024 Estimated Totals | 16,505 | 44,252 | -34,798 |
| *Withdrawal Avg. 1.84 Acre-Ft/Acre | *Withdrawal Avg. 2.7 Acre-Ft/Acre | *Withdrawal Avg. 2.68 Acre-Ft/Acre | ||||||
The table above shows the acreage and associated water demand estimates, separated by subbasin, for 2019 and 2024 from the HVB Study compared to the active farm acres observed in November 2024 and the associated water demand.
*Per page 22 of the HVB Study, the annual withdrawal rates for each group of farms were linearly interpolated for 2019, 2024, and 2029, which is why the 2019 average withdrawal rate was 1.84 acre-feet per acre and the 2024 was up to 2.7 acre-feet per acre. 2029 was not included for the purposes of this report. The withdrawal rate of 2.68 acre-feet per acre used for this update is explained in the assumptions and is on par with the 2.7 acre-feet used in the HVB.
The 2021 HVB Study projected the following:
- An increase in total cultivated acreage from 2019 to 2024 of 15,188 acres (14,090 to 29,278).
- An increase in total estimated water demand from 2019 to 2024 of 52,990 acre-ft (26,060 to 79,050).
These projections were prior to the Hualapai Valley Irrigation Non-Expansion Area (INA) being established in December 2022. The establishment of the INA made it so that only acres that had been irrigated within the five years preceding the initiation of the procedures to designate the INA (October 12, 2022) could be irrigated. This means that cultivated acres can still increase if the farm already has established acreage with ADWR water rights they are not currently cultivating.
The actual 2024 totals are as follows:
- The total cultivated acres increased by 2,415 acres (14,090 to 16,505). 12,773 acres less than originally projected. The Hualapai Subbasin decreased in cultivated acres from 2019 instead of the estimated 191% increase.
- The total overall estimated water demand for the basin was 34,798 acre-ft less than originally projected (79,050 vs 44,252). However, the main reason for the lower number is due to the decrease in cultivated acres instead of the projected major increase within the Hualapai Subbasin. The Kingman and Gregg Subbasin growth was slightly higher than projected, creating a higher than expected demand in those areas. This is especially concerning in the Kingman Subbasin.
HVHM RESULTS
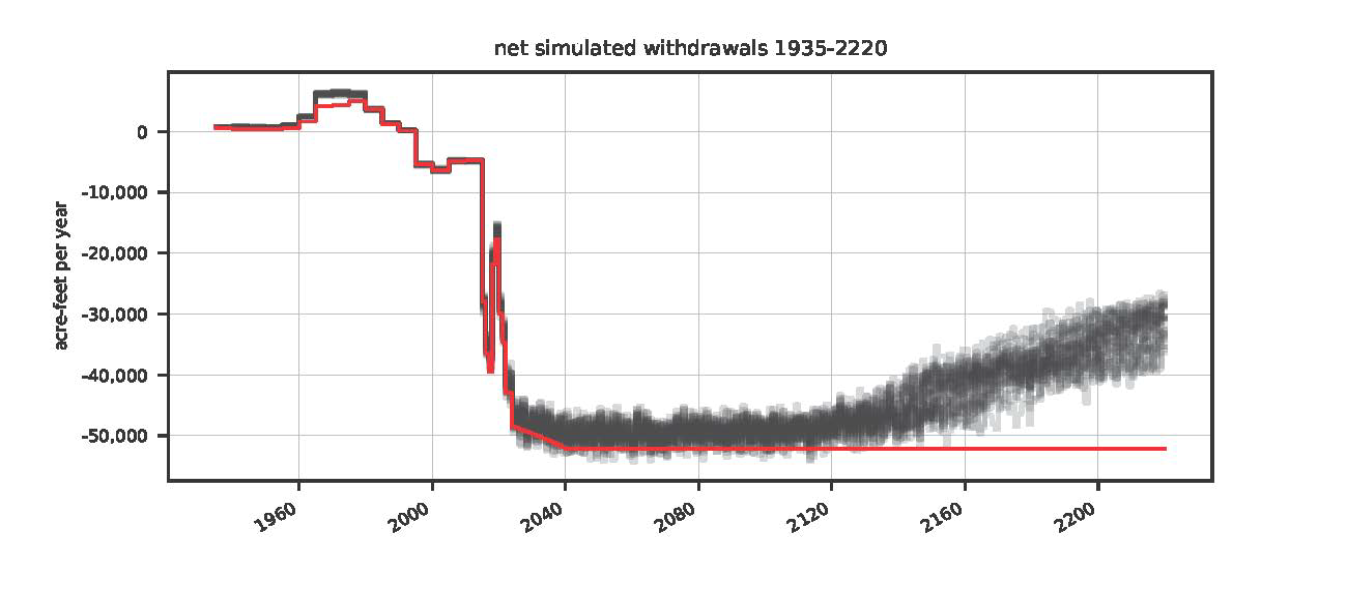
In the graph below, the red line represents the wells reaching maximum pumping based on our input table. However, the most valuable information comes from the black lines, which show the results of 40 simulations of maximum pumping by year. These simulations indicate consistent pumping volume through approximately 2120, followed by a slow decrease in pumping volume through 2200. This gradual decline over an extended period of time is also a result of model cells around the perimeter of the basin drying up, but water would still be available toward the middle of the basin at a potentially lower depth.
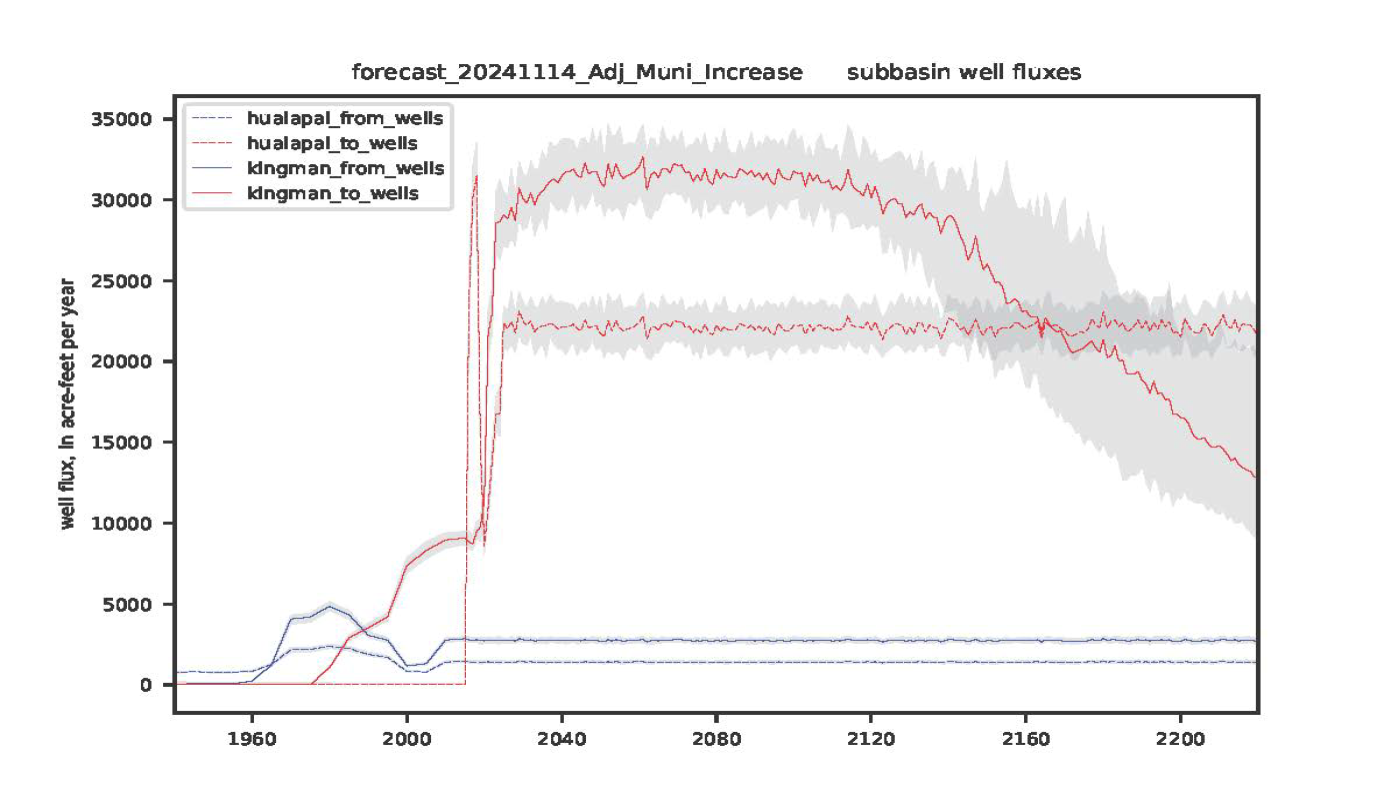
The graph below analyzes pumping trends in the Hualapai and Kingman subbasins.
- Kingman Subbasin: The median pumping rate (top red line) remains high until around year 2120, then starts to gradually decline. This decline shows the forecast is less accurate after 100 years due to cells in the model drying up. The grey area represents the range of the 40 different model simulations.
- Hualapai Subbasin: The median pumping rate (bottom red line) remains more stable over time due to less pumping and a larger area source of water as seen in the map on page 2.
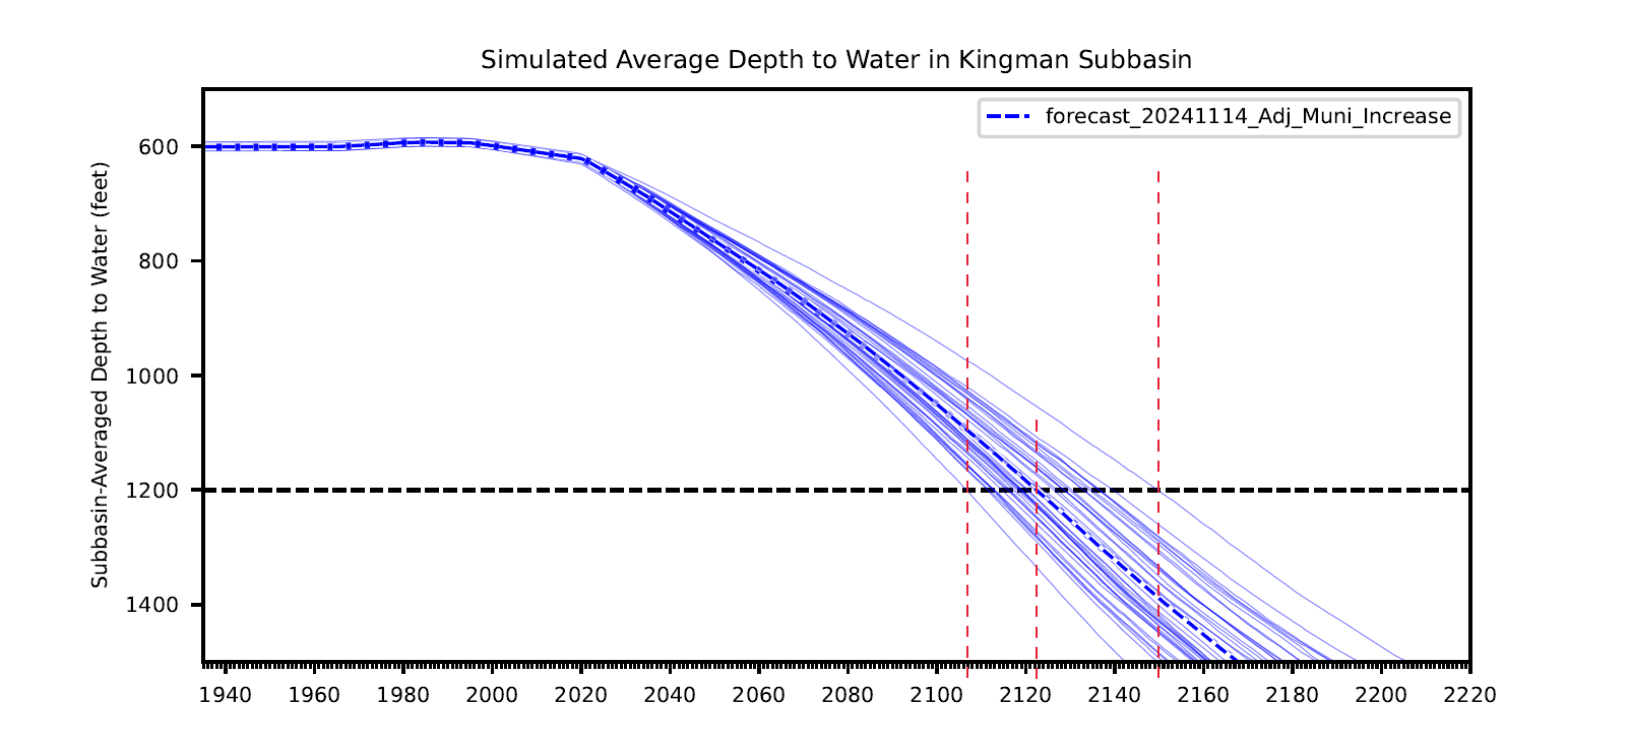
The graph below shows when the average well depth required to reach water drops below 1,200 feet in the Kingman Subbasin. The median line of the simulations indicates this occurs shortly after 2120. This does not mean water is unavailable; rather, it suggests that wells will need to be drilled deeper to access it, based on this forecast.
The updated groundwater budget table below indicates a current annual deficit of approximately 50,000 acre- feet for the entire basin. While the withdrawal rates of municipal and personal wells (exempt wells of 35 gallons per minute or less) have remained relatively stable, a nearly 60% increase in agricultural groundwater pumping has significantly increased the annual deficit. This table covers the entire basin, but based on the active farm numbers, we know the largest portion of the deficit comes from the agricultural pumping in the Kingman Subbasin.
| Ground Water Budget Update | ||
| Basin Recharge | 2021 HVB | 2024 Update (acre-ft/yr) |
| Natural Recharge1 | 5,000 | 5,000 |
| Incidental Recharge1 | 4,500 | 4,500 |
| Infiltration Project Recharge2 | 1,200 | 0 |
| Total Inflow | 10,700 | 9,500 |
| Basin Withdrawals | ||
| Natural Discharge1 | -5,600 | -5,600 |
| City of Kingman Wells3 | -8,900 | -8,627 |
| Foothills Utilities Wells4 | 0 | -268 |
| Personal Wells5 | -1,100 | -1,227 |
| Agricultural Wells | -26,000 | -44,252 |
| Total Outflow | -41,600 | -59,974 |
| Total Deficit | -30,900 | -50,474 |
1These numbers are based on Table 2 (page 15) of the 2021 HVB and are considered the same for the purposes of this update
2This was included in the 2021 HVB but was not used in the 2024 update
3The 2024 number is pulled directly from ADWR well pumping date for the City of Kingman Wells in 2024
4These wells were not included in the 2021 report, but are included in the update with the ADWR well pumping data for 2024
5The same 2.3% annual increase assumption used for the municipal wells was used for this number in the 2024 update
Future Efforts: The City of Kingman has built and permitted a recharge well with plans to pump excess effluent into the Kingman Subbasin aquifer. The City is currently working on making sure the effluent will meet all water quality requirements before it begins to utilize the well.
The County is working on multiple recharge basin construction projects to help excess runoff find its way into the Kingman Subbasin while providing valuable flood control to downstream properties.
Additionally, the County is working on three monitoring wells at various locations withing the Kingman Subbasin area to provide actual water level readings. These wells are expected to be complete by the end of 2025 and over time will provide valuable information.
Conclusion: The updated forecast reinforces and confirms the trends identified in the HVB Study, and even though the overall cultivated land and water demand estimates are better than projected, there remains a concern in the Kingman Subbasin. Without the actual water draw numbers from the agricultural wells, we can only rely on the model information at this time. The model forecast confirms a gradual decline in water levels in the Kingman Subbasin. The increased annual groundwater deficit, which is primarily from the Kingman Subbasin, remains a major concern.
While groundwater remains accessible, proactive planning will be essential to ensure sustainable use of the Hualapai Valley Groundwater Basin and each of its subbasins. This may include the relocation of certain wells that are closer to the boundary of the basin and/or deeper drilling as we reach the 2100s, all of which will require extensive funding.
For additional Mohave County Water Information, visit: https://www.mohave.gov/departments/development-services/mohave-county-water-information