Assessing the Impacts of Groundwater Withdrawals on Aquifer Conditions and the Evaluation of Engineering Solutions - Nick Hont Date: 2/7/2017
Assessing the Impacts of Groundwater Withdrawals on Aquifer Conditions and the Evaluation of Engineering Solutions
Nick Hont, P.E.
Civil Engineer
Mohave County Development Services
Summary of Water Supply Problems from an Engineering Standpoint:
- Need to define the impact of agricultural water withdrawals in the Hualapai Valley and to develop tools to determine the time we have to act and implement possible solutions; and
- Need to evaluate available solutions and the feasibility of remediation measures to support the Kingman area water supply.
Summary of Groundwater-Budget Components
Table 2. Summary of groundwater-budget components from Garner and Truini (2011)
(groundwater-budget values are in acre-feet per year; less than; WWTP wasterwater treatment plant)
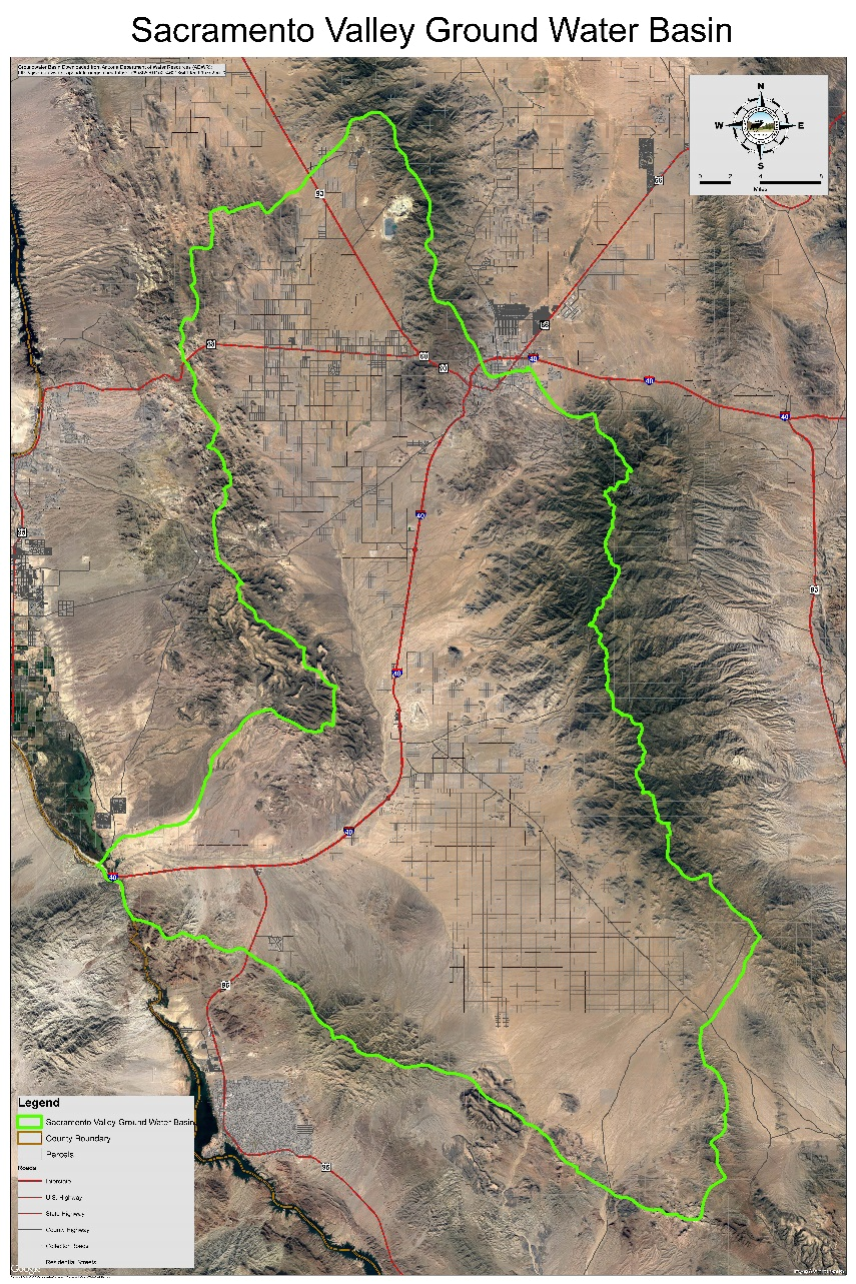
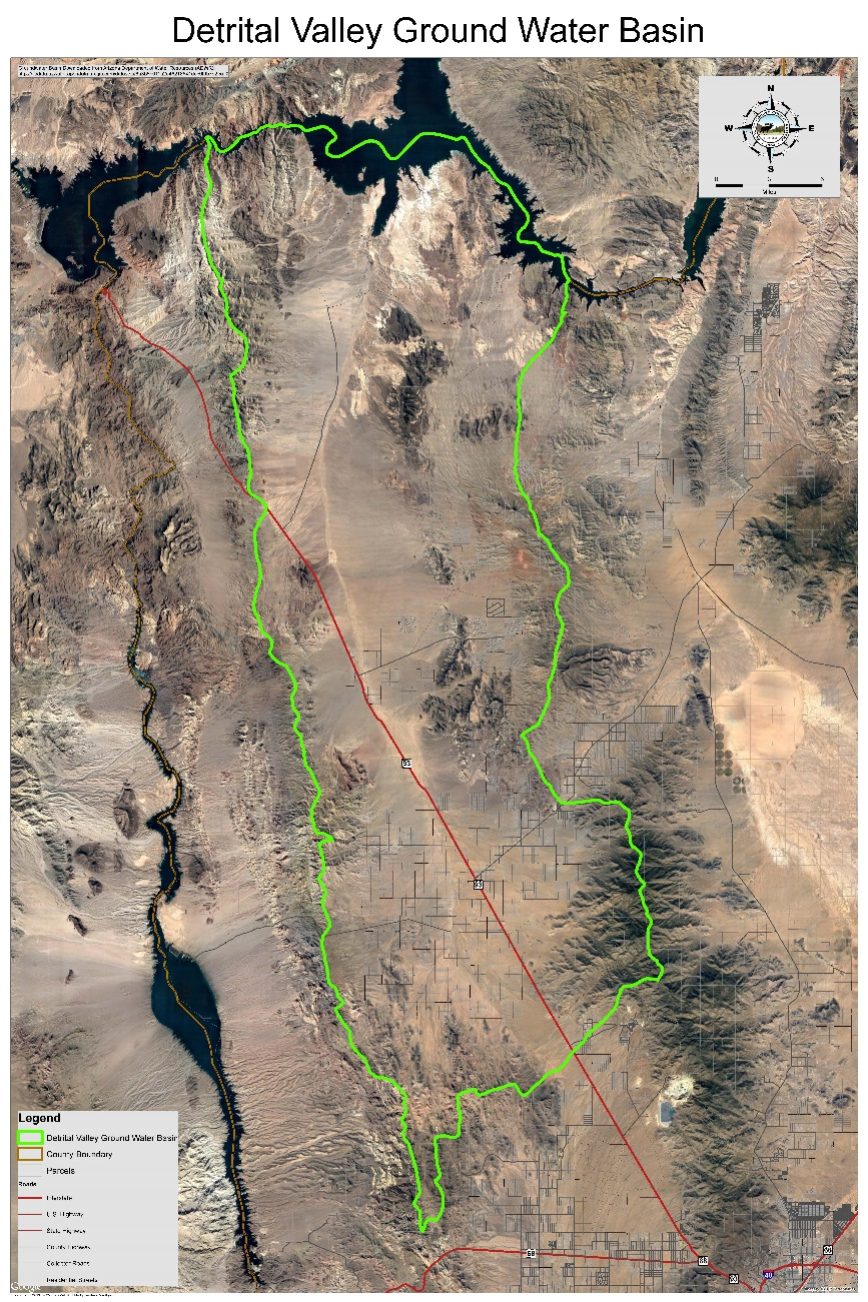
| Water-budget component | Detrital Valley Basin | Hualapai Valley Basin |
Sacramento Valley Basin |
|||
| Inflow to aquifer | Outflow from aquifer | Inflow to aquifer | Ouflow from aquifer | Inflow to aquifer | Outlow from aquifer | |
| Natural recharge | ||||||
| Mountain-block recharge | 1,200 | 4,400 | 5,200 | |||
| Named ephemeral stream-channel recharge | 600 | |||||
| Other ephemeral stream-channel recharge | <300 | 400 | 800 | |||
| Underflow in | 1300 | |||||
| Natural discharge | ||||||
| to Lake Mead or Colorado River | 1,400 | 5,700 | 24,000 | |||
| Phreatic evapotranspiration (ET) | <300 | <300 | 22,000 | |||
| Groundwater withdrawals | <300 | |||||
| Kingman municipal | 7,600 | 500 | ||||
| Community water suppliers | 500 | 2,000 | ||||
| Self-supplied domestic | 500 | 100 | ||||
| Industrial | 1,900 | |||||
| Interbasin transfer | 1,200 | (3) | ||||
| Incidental Recharge | <300 | 500 | 4<300 | |||
| Infrastructure leakage | 41,700 | |||||
| Septic systems | 4<300 | |||||
| Treated WWTP effluent | ||||||
| Totals | 1,600 | 1,600 | 9,900 | 15,500 | 8,200 | 10,500 |
1From Freethey and Anderson (1986) predevelopment conditions.
2Partioning between Colorado River and phreatic evapotranspiration uncertain becauseof a lack of data
3Groundwater is transferred in from Hualapai Basin, but is not shown here it is not part of the groundwater budget of Sacramento Valley Basin
4Includes the effects of 1,200 acre-feet/year of water transferred from Hualapai Valley for Kingman
Hydrology Background
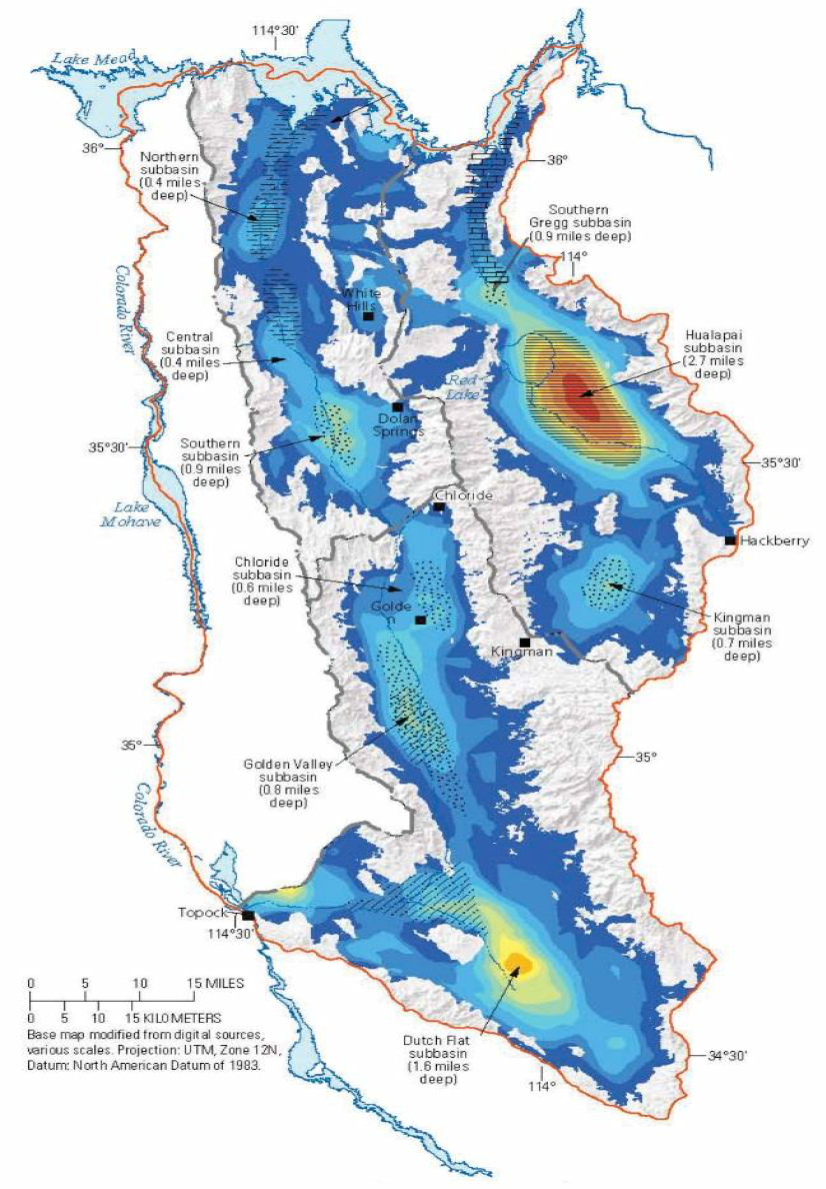
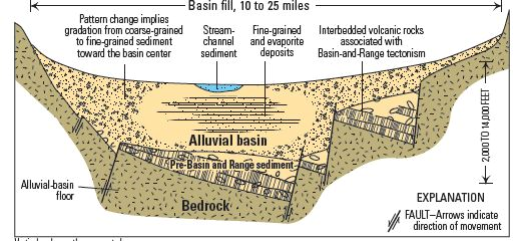
Mohave County’s Basin and Range basin‐fill type aquifers consist primarily of sediment‐filled basins separated by mountain ranges. Basin‐fill deposits range
from about 1,000 to 5,000 feet in thickness but are thinner or thicker in some locations. Groundwater is mostly unconfined, but there were some underlying confined aquifers confirmed in the Big Sandy Valley Basin. Most precipitation is lost to evapotranspiration.
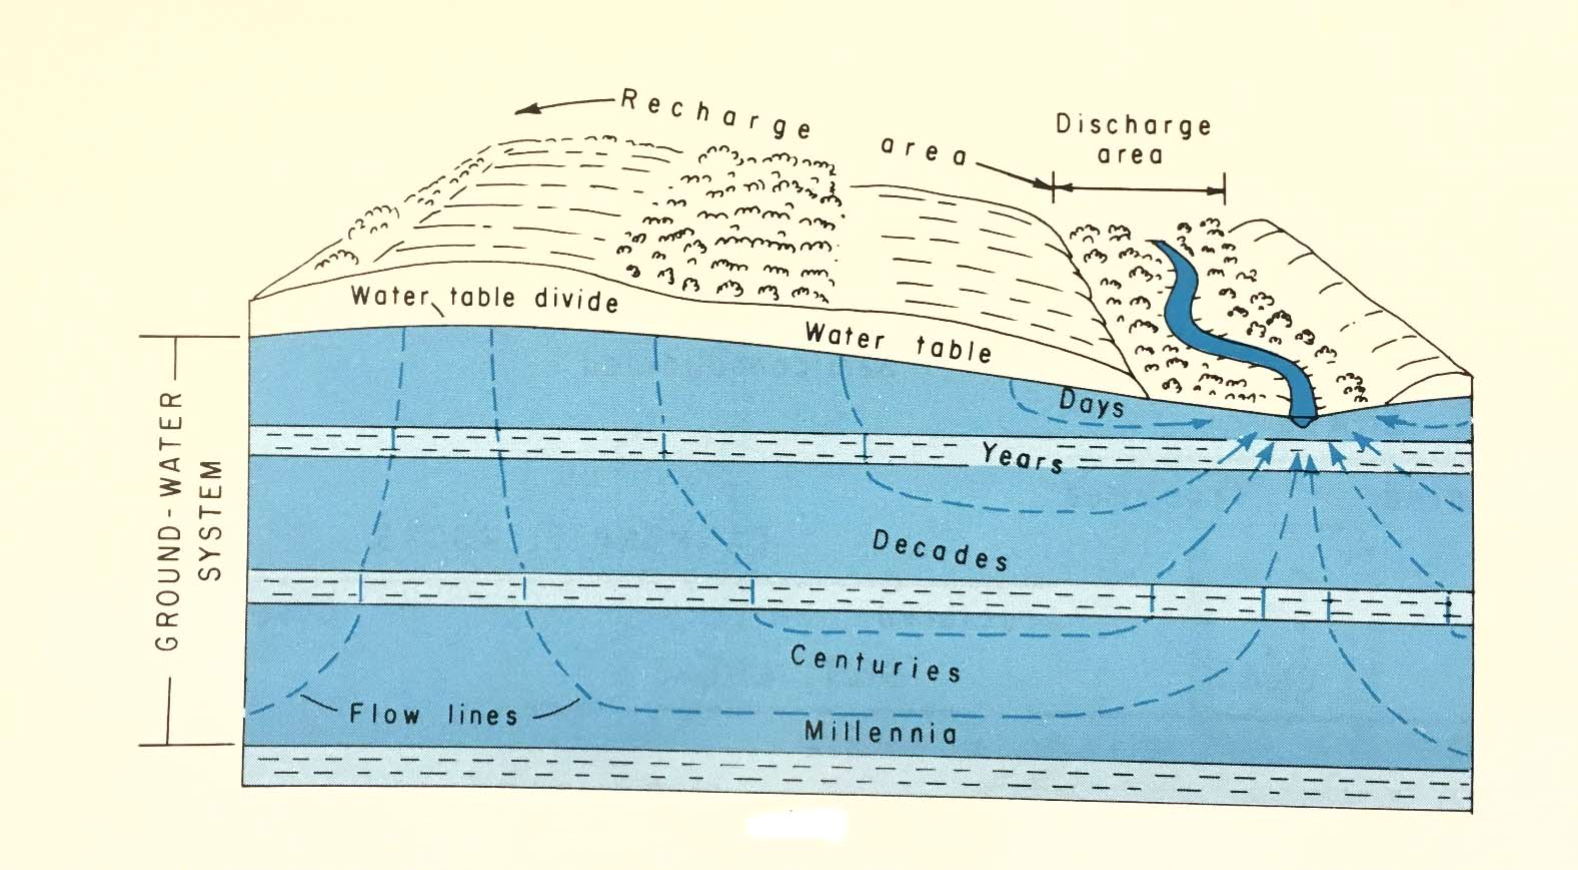
Groundwater recharge from infiltration of mountain streams and inflow from fractured bedrock typically enters the aquifers along the foothills of the mountains.
Functions of Groundwater Systems
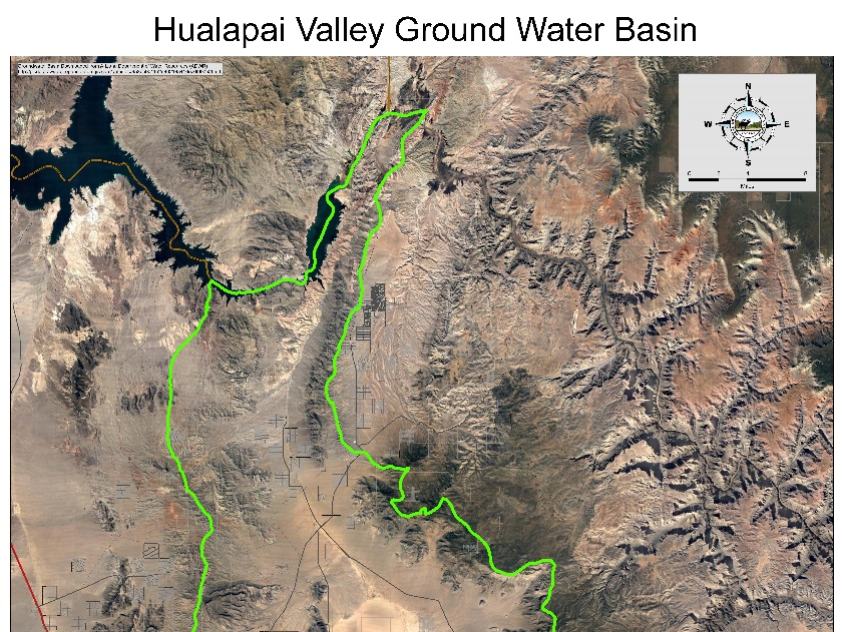
Since 2012, major new agricultural developments drastically modified and increased the water withdrawal from the aquifer, thus dramatically increasing the previously existing water deficit.
• Rhodes‐owned Kingman Farms, LLC anticipated an annual consumption of water for agricultural purposes in the ballpark of 20,000 acre‐feet annually.
• Stockton Hill Farms investment planned to withdraw from the Hualapai Valley Groundwater Basin annually somewhere between 60,000 and 70,000 acre‐feet of water to irrigate about 12,000 acres of planted land by 2017.
Based on the available info from the Kingman Farms and Stockton Hill Farms investments, the anticipated annual groundwater withdrawal from the Hualapai Valley Groundwater Basin for irrigation will have increased dramatically from zero in 2014 to over 80,000 acre‐feet of water in 2017, which will result in a groundwater deficit in the basin of over 85,000 acre‐feet annually.
• This is a very conservative estimate and does not represent other investments and agricultural operations that have recently been, or planned to be established in the Hualapai Valley Groundwater Basin.
• Land within the Hualapai Valley Groundwater Basin is actively marketed to agricultural developers.
Arizona Department of Water Resources Well Records
• Well data obtained from the ADWR’s website in March of 2016 indicated 134 existing farming wells located in the Hualapai Valley Groundwater Basin.
• The wells being drilled for agricultural use are 16 to 24 inches in diameter and can withdraw up to 3,500 gallons of water per minute.
• Assuming that all wells were pumped only three hours each day, the total annual groundwater withdrawal from these wells alone could be over 90,000 acre‐feet per year.
POSSIBLE ENGINEERING SOLUTIONS
1. U.S. Geological Survey (USGS) proposal to assess the impacts of increased withdrawals on aquifer conditions
2. Evaluate the feasibility of mitigating measures by groundwater recharge
U.S. Geological Survey Proposal • The purpose will be to establish with accuracy the effects of groundwater withdrawals.
• The models will be used to predict the impact of the agricultural well pumping and different areas of the basin, and more importantly, the anticipated time frames for the change of water levels in the aquifer.
• The models will also be used to predict the impact of the proposed mitigating measures of water injection through recharge basins.
• Different scenarios for the model will be developed with input from Mohave County.
For the proposed project, the USGS proposes to perform and provide:
1. Gravity surveys to establish current groundwater levels;
2. An aquifer monitoring program; and
3. A groundwater flow model.
Functions of Groundwater Systems
Estimated budget for planned work in Monitoring Program
| Monitoring program | Gross Cost Year 1 | Gross Cost Year 2 | Gross cost Year3 |
| Instrument Wells for Water-Level Monitoring | |||
| Up to 10 Wells | $25,000 | ||
| Up to 3 New Wells | $3,900 | ||
| Monitor Wells for Water-Levels | |||
| Up to 10 Wells, Inclusive Cost for 1 year | $15,000 | $7,800 | |
| Up to 13 Wells, Inclusive Cost for 1 Year | $10,000 | ||
| Gravity Monitoring | |||
| Up to 15 sites, Inclusive Cost for 1 site | $30,000 | $15,500 | |
| Up to 20 sites, Inclusive Cost for 1 visit, 2 visits per year | $20,600 | $42,400 | |
| Project Management | $5,300 | ||
| Total | $90,300 | $60,400 | $63,100 |
Model Revision and Scenario Testing program and annual grand total costs
| Model Revision and Scenario Testing program | Gros Cost Year 1 | Gross Cost Year 2 | Gross Cost Year 3 |
| Obtain Modeling Scenarios | $12,000 | ||
| Compile Additional Model Calibration Data | $6,000 | ||
| Recalibration of Existing Model | $18,000 | ||
| Scenario Modeling | $33,000 | 33,700 | |
| Report Writing | $55,200 | $19,000 | |
| Report Editing | $19,000 | ||
| Report PUblication | |||
| GIS Metadata publication | $10,300 | ||
| SPN Interaction and review | $3,100 | ||
| Model Archiving | $6,300 | ||
| Revise Groundwater Monitoring Plan | $7,100 | ||
| Project Management | $6,400 | $6,400 | |
| Total | $69,000 | $102,400 | $64,100 |
| USGS COST Share | ? | ? | ? |
| Mohave County | ? | ? | ? |
| City of Kingman | ? | ? | ? |
| Grand Total | $159,300 | $162,800 | $127,200 |
POSSIBLE MITIGATING MEASURES BY RECHARGING STORM WATER INTO THE AQUIFER
• The suitability of a potential recharge basin site is determined by its location.
(Just like in real estate, the three most important factors influencing cost are location, location and location.)
• Locate major washes
• Find suitable and affordable properties along washes
– BLM land with application to BLM
– County and City right‐of‐ways and drainage parcels
– Private property donations or reasonable land purchase
• Evaluate the flow and quantities, the percolation capacity of the subsurface alluvial soils and the feasibility of construction
A Critical Factor for site Selection: Underlying Subsurface Soil Conditions
The recharge method will be selected based on the feasibility of the site subsurface soil conditions. The percent of fine‐grained soils content, such as silt and clay content, and the chemical composition of the fine‐grained soils usually make a big difference in the hydraulic conductivity of any given soil.
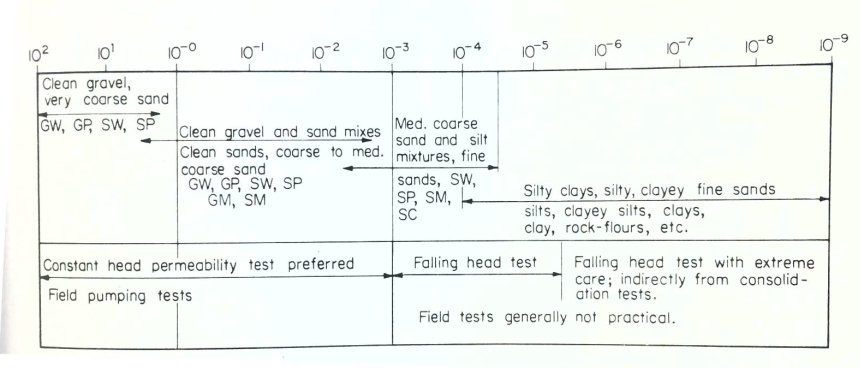
What the Hydraulic Conductivity Numbers Mean
It is important to note what the numbers mean, that is for example 1X10E‐4 is 10 times smaller than 1X10E‐5 , and the corresponding percolation and recharge rate will be 10 times faster.
In other words, the hydraulic conductivity and the corresponding recharge capacity of a clean sand will be 100 to 1,000 times greater that of a silty sand and 1,000 to 10,000 times greater than a clayey sand.
This illustrates that recharging into soils with relatively high fines content is not considered feasible. In general, this will exclude subsurface soils containing silt in the amount of over 30% or clay in the amount of approximately over 20%.
Engineering Measures to Facilitate Infiltration or Reinjection of Surface Water
Sites containing underlying subsurface soils of clean sand and gravel with a negligible silt content will be suitable for recharge basin without any further engineering measures.
For sites consisting of near‐surface soils relatively high fines content (silt or clay), the installation of additional relatively costly recharge facilities will be required, such as
- Gravel filter infiltration layer, with installation generally feasible to a depth of no deeper than approximately 15 feet; or
- Injection wells, with installation feasible to depths possible to several hundreds of feet, but at a much higher cost.
Recharge Basin Types Without Gravel Infiltration Layer or Injection Wells
New research published by Stanford University’s Water in the West program shows that groundwater can be achieved at a median cost of $390 per acre‐foot. In order to replenish aquifers, surface water must find its way underground.
Shallow basins
- Constructed by spreading the surface water over a larger area
and - Constructed by excavation and by filling series of berms
- Deeper basins constructed by
excavation and embankment
- Deeper basins constructed by
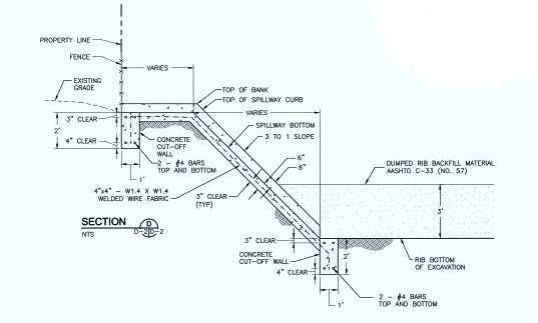
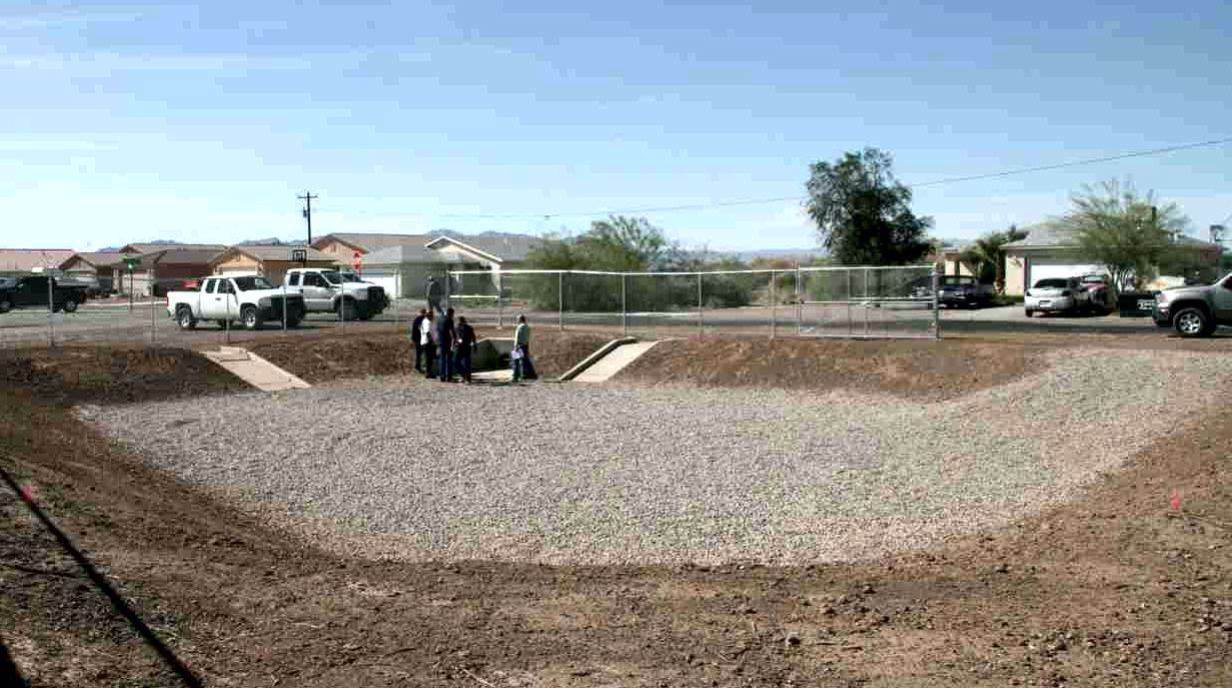
Project Example Designed and Constructed by Mohave County Flood Control District
Quail Run Infiltration Basin Project
Feasibility Engineering Evaluations
- For each wash, establish engineering hydrology the flow and quantities for10% annual probability
- Evaluate the site geometry and suitability of the site for recharge basin construction
- Evaluate and test for potential contaminants in the water and near surface soils, such as
- Hydrocarbons, solvents, soluble lead for sites where the surface water may be generated from paved areas,
and - Salts, pesticides and herbicides where the water may be generated from dry lake, or agricultural areas.
- Hydrocarbons, solvents, soluble lead for sites where the surface water may be generated from paved areas,
- Evaluate the stratigraphy and geotechnical engineering properties of the subsurface materials and anticipated percolation rate:
- Visual classification of near‐surface soils and estimation of hydraulic conductivity
- Backhoe pits and soil sampling to about 10‐foot depth for laboratory soil classification tests (gradation and PI tests) to estimate the hydraulic conductivity
- Soil borings to 10 to 50 feet of depth to collect core samples and determine the hydraulic conductivity by laboratory testing (triaxial coefficient of percolation test)
- Engineering calculations for the amount of rechargeable water at each location
- Conceptual engineering design of recharge basin
- Engineering cost estimate of construction
- Cost‐benefit evaluation of the specific site location
Final Steps Following Site Selection
- Engineering Design
- Site surveying to establish a topographic map with one‐foot elevation
contours - Grading engineering design and specifications
- Permitting with ADWR
- Site surveying to establish a topographic map with one‐foot elevation
- Legal Clearance
- Waters of the U.S.; determined by the Army Corps of Engineers and ADEQ
- Surface Water Allocations; determined by ADWR
- Construction
1. Long‐term Maintenance