Rosy Canyon Road
EFFICIENT ROAD SURFACING PRACTICE ENABLING RURAL CONNECTIVITY AND ECONOMIES
S.P. LATOSKI
Public Works Department, Mohave County, Arizona, USA
ABSTRACT
Hard surfaced roads comprise backbone civil infrastructure in supporting mobility and transport safety as well as agricultural, tourism, and mining/commodities industries common to rural, remote areas. A proven and practice-ready approach exists for improving unsurfaced roads to hard surfaced condition and providing surface rideability akin to concrete paved roadways. This yields numerous positive outcomes central to mobility, reliability, livability, and cost rewarding communities, road users, and transportation agencies served. Resulting all-weather, resilient roads reduce travel time, reduce travel distance through densifying a region’s surfaced road network, reduce crash likelihood, reduce fuel use and related vehicle operating expenses, eliminate fugitive dust particulate matter pollution and road maintenance burden attributed to loss of valuable roadbed fine material binder, and resist severe weather impact that demand onerous maintenance and repair. Quality of life and economic competitiveness underpin hard surfacing justification and its long-term benefit through access to employment centers, commodities, attractions, schools, and essential/emergency services in addition to promoting multimodal transport opportunities including bus and non-motorized modes.
Rural Mohave County, Arizona (population 200,186) maintains 1,355 centerline kilometers of paved and hard surfaced roads in addition to 2,028 centerline kilometers of unsurfaced roads throughout a 34,478 square-kilometer area, which geographically represents the fifth largest county in the contiguous United States. The County has improved over 100 kilometers of these roads from an unsurfaced condition over the past 15 years. Through this success, a practice-ready soil stabilization and hard surfacing approach is presented in context of offering policy and procedure for project selection, engineering method to evaluate roadbed soil potential for successful treatment acceptance, economic benefit methodology for project justification, and construction procedures. Hard surfacing and its inherent cost-effectiveness entails bituminous oil seal coat over structural base application. Project selection need evaluate roadbed soil composition – a measure of load-carrying capacity – against traffic load demand as roads serving 100 to 400 vehicles per day under silty/clayey to gravelly roadbed soils may accept the application. Engineering study on historical Mohave County soil stabilization and hard surfacing work yields statistically significant finding that roadbed soil properties influence and positively correlate to post project roadway surface wear. Funding and project prioritization may factor an engineering economic analysis to discern benefits central to crash cost savings, travel time savings, and vehicle operating expense reduction. Mohave County consistently finds its hard surfacing projects provide attractive return on investment through monetary benefit to the public exceeding project capital cost.
1. INTRODUCTION
Few civil infrastructure improvements yield the breadth of benefits toward rural public health, safety, and welfare and rural economies as improving unsurfaced – native soil (dirt) or gravel – roads to hard surface condition, defined by the traveled way surface course comprised of bituminous surface treatment placed on mechanically and/or chemically prepared base and subbase courses. Hard surfaced roads provide sustained rideability service levels akin to structural paved roads when serving primarily low volume passenger car and light truck traffic. Ancillary benefits include (1) traffic safety through increased surface friction and uniform traveled way, (2) all-weather access and efficient emergency services response, (3) less motor vehicle wear and tear, and (4) limited to nil fugitive dust release through trafficked corridors. Collectively, hard surfaced roads enhance motorist experience, community quality of life, and commerce.
This paper presents methodologies promoting cost-effectiveness and serviceability in developing hard surfaced roads sans traditional asphalt or Portland cement concrete (re)construction. It draws on experience and success of Mohave County, Arizona (2010 population: 200,186), which has improved over 100 kilometers of roads from an unsurfaced condition over the past 15 years. Mohave County maintains 1,355 centerline kilometers of paved and hard surfaced roads in addition to 2,028 centerline kilometers of unsurfaced roads throughout a geographic area totaling 34,478 square kilometers representing the fifth largest county by land area in the contiguous United States. In November 2017, the County hard surfaced 7.3 kilometers of Rosy Canyon Road through a winding alignment bisecting a remote canyon to establish continuous hard surfaced connection between the greater Colorado City, Arizona area and State of Utah. Project boundaries locate at 36.9469° N, 112.8845° W and 37.0003° N, 112.8615° W. This work proves a boon for local agricultural commerce as well as visitors frequenting numerous National Park System and other park and recreation destinations through southern Utah and northern Arizona bounded by Zion and Grand Canyon National Parks.
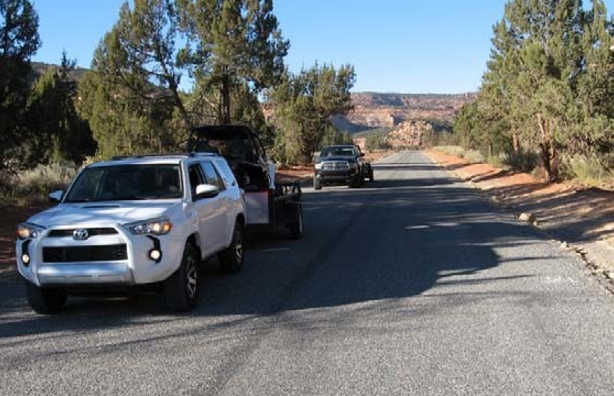
Figure 1 – Recreational Traffic Traversing Rosy Canyon Road Post-Project
2. PLANNING
2.1 Program Level
Consistency in project identification and planning demands guiding management practice. Any hard surfacing program should incorporate relevant agency standards and supporting engineering methods toward (1) identifying and prioritizing unsurfaced jurisdictional roads and (2) selecting proven construction materials and techniques for purpose of improving quality of life and reducing long-term road maintenance expense. Qualifying prerequisite criteria for any project may emphasize roads providing mobility and place-to-place connection over intra-place and residential access. Added criteria may include perfected, continuous right-of-way and candidate roads laid out to adopted agency standards for road geometry and without intersecting floodway or other drainage features necessitating costly improvements. Table 1 lists target evaluation criteria central to road and traffic conditions essential to hard surfacing success coupled with existing maintenance and area characteristics promoting project consideration [2].
Table 1 – Hard Surfacing Project Evaluation Criteria
|
Criterion |
Value |
Purpose |
|
Roadbed Soil Strength |
Gravelly1 = good Sandy2 = fair Silty/clayey3 = poor |
Soil strength influences performance capacity |
|
Average Daily Traffic |
Gravelly soils = 400 vpd4 Sandy soils = 250 vpd Silty/clayey soils = 100 vpd |
Traffic demand above recommended threshold may affect service life without expanded project base course work or structural surface treatment |
|
Washboard Susceptibility |
Soil plasticity index less than 10% |
Unsurfaced roads susceptible to washboard and related undulations increase maintenance burden and expense |
|
Abutting Property Characteristics |
Developed properties served by project |
Improve access reliability, quality of life and commerce |
|
Thoroughfare Potential |
Project specific travel distance and time saved |
Improve mobility and quality of life |
- Reference Unified Soil Classification System GW, GP, GM, and GC soils
- Reference Unified Soil Classification System SW, SP, SM, and SC soils
- Reference Unified Soil Classification System CL, ML, CH, MH, and organic soils 4 vpd = vehicles per day
2.1.1 Roadbed Soil Effect
Roadbed (i.e., native or subgrade) soil strength and stiffness influence long-term performance of any road surface treatment. Mohave County demonstrates through its 2009 macro-level engineering evaluation performed subsequent to its four-year, non-structural hard surfacing program in the mid-2000s that yielded 101 kilometers of roads improved from preexisting unsurfaced state. The aforementioned program delivers chip seal surface treatment over either asphalt millings as sourced to recycled asphalt concrete pavement or soil stabilized roadbed using an acrylic liquid polymer stabilizer.
Mohave County, through its Public Works Department, performs annual inspection of maintained paved and hard surfaced roads for purpose of archiving and monitoring extent and severity of common pavement distresses such as cracking and surface undulation. A 2009 survey found 67 percent, 17 percent, and 16 percent of those roads bettered through hard surfacing exhibited good, fair, and poor road surface condition, respectfully. The County’s engineering evaluation on roadbed soil properties’ correlation to surface condition references National Resources Conservation Service (NRCS) maintained soil maps and data published in geographic information systems application. This NRCS Web Soil Survey gives location-specific ratings on roadbed soil performance as it affects ease of excavation and grading and traffic-supporting capacity for local roads and streets [1]. NRCS classifies these ratings under three criteria: not limited, somewhat limited, and very limited. It derives ratings for soil properties influencing load capacity on soil strength, subsidence, shrink-swell potential, frost action potential, depth to a water table, and ponding.
The evaluation considers 35 distinct road segments improved under the hard surfacing program, totaling approximately 64 centerline kilometers. This excludes approximately 37 kilometers of treated roads, which either received post-program second chip seal treatment or exhibited distress attributed to other factors unrelated to subgrade per inspection reports. Therefore, it compares 24 road segments having good surface condition rating, based on County survey, to 11 segments having fair or poor surface condition rating. The following denotes the evaluation approach:
- Assign score to NRCS soil rating of 3 = not limited, 2 = somewhat limited, and 1 = very limited. A higher rating reflects soil properties more conducive to positive performance in road construction works.
- Execute Web Soil Survey analysis to determine soil rating and percent area coverage within each road segment alignment.
- Compute soil rating weighted average for each road segment.
Table 2 summarizes analysis results using weighted NRCS soil performance ratings characterizing ease of excavation and grading and traffic-supporting capacity for local roads and streets as applied to evaluated road segments. It yields statistically significant finding at 90 percent confidence interval (t-statistic = 1.823) that roadbed soil properties influence and positively correlate to road surface condition. This proves important in forward planning and analysis for hard surfacing work whereby roadbed soil properties and representative technical data may input into engineering decisions on subgrade preparation, base and subbase treatment, or ultimately project viability for its long-term success.
Table 2 – Soil Performance Rating to Road Surface Condition
|
Surface Condition |
Soil Rating |
|
Good |
2.1 (24 segments) |
|
Fair or Poor |
1.7 (11 segments) |
|
Total Network |
2.0 (35 segments) |
2.2 Project Level
Framing project viability entails evaluating tangible benefits to current and future road users in context of mobility, travel time reliability, safety, and vehicle operation cost. Agencies may realize reduced maintenance burden attributed to erosive storm impacts and ongoing loss of road surface fine material binder to fugitive dust release that drives unsurfaced road routine maintenance frequency and unplanned repair. Figure 2 underscores this phenomenon through its experience maintaining Rosy Canyon Road. Unequivocally speaking, hard surfacing represents a bona fide betterment work that enhances rideability condition, improves quality of area served, and provides uniform, all-weather traveled way surface. However, cost-effectiveness underpins project justification for construction expenditure, and project viability should consider monetary value of aggregate user benefits to total project cost under specified life cycle (service life). Table 3 identifies criteria toward evaluating and estimating user benefits borne from undertaking any hard surfacing project. Twenty years represents reasonable service life for newly hard surfaced, low-volume roads until next contemplated rehabilitation or reconstruction.
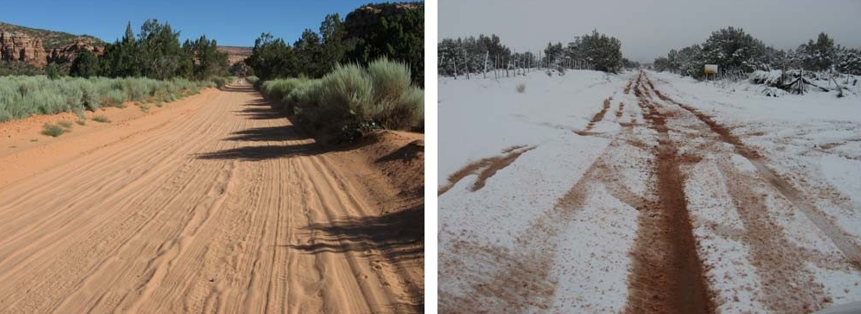
Figure 2 – Rosy Canyon Road Typical and Post-Storm Condition Prior to Hard Surfacing
Table 3 – Hard Surfacing Project User Benefits Criteria
|
Criterion |
Input Variable |
Monetizing Factor |
|
Fuel Savings |
1. Existing average daily traffic 2. Estimated average daily induced traffic previously using longer hard surfaced routes connecting common places served by project 3. Project distance 4. Travel distance savings to induced traffic 5. Average fuel economy for light-duty vehicles 6. Unit fuel cost |
Percent fuel economy increase attributed to hard surfacing and travel distance savings by induced traffic |
|
Travel Time Savings |
1. Existing average daily traffic 2. Estimated average daily induced traffic 3. Travel time savings to existing traffic, if applicable 4. Travel time savings to induced traffic 5. Average vehicle occupancy 6. Unit user value of travel time savings |
Potential increased traffic speed attributed to hard surfacing and travel time savings gained by induced traffic |
|
Crash Reduction Savings |
1. Existing average daily traffic 2. Project distance 3. Historical crash rate within project limits in crashes per million vehicle kilometers or deaths per 100 million vehicle kilometers 4. Unit monetized value of crash or death |
Crash reduction factor on hard surfacing existing unsurfaced roads |
2.2.1 Fuel Savings
Fuel savings comprises benefits specific to existing and new, induced road users. The latter user group will divert to the improved facility when experiencing shorter travel distance and time savings between common places served by the improved facility. Existing users will realize fuel savings attributed to reduced fuel use through travel on hard surfaced road condition. Rolling resistance weighs on vehicular performance, and numerous studies in the literature estimate hard surfaced roads reduce rolling resistance by approximately two thirds to comparable gravel and dirt surfaced roads [3]. The United States Department of Energy finds light-duty vehicles experience 1 – 2 percent increase in fuel economy for every 10 percent decrease in rolling resistance [4]. The International Energy Agency reports weighted average fuel economy of new light-duty vehicles on the World Harmonized Light Duty Vehicle Test Cycle, representing typical driving characteristics around the world, stands at 7.6 liters of gasoline equivalent per 100 kilometers (lge/100km) in 2015 [5]. Therefore, the literature infers hard surfacing yields approximate 10 percent increase in vehicular fuel economy and approximately 0.76 lge/100 km fuel savings per average light duty vehicle. The following expressions calculate annual road user benefit attributed to fuel savings.
- (existing average daily traffic volume) * (365 days/year) * (project distance in km / 100) * (0.76 lge/100 km) * (local fuel price per liter)
- (induced average daily traffic volume) * (365 days/year) * (induced traffic travel distance savings in km / 100) * (7.6 lge/100 km) * (local fuel price per liter)
Rosy Canyon Road served 131 vehicles per day prior to Mohave County undertaking its hard surfacing work. During Project planning, the County estimated induced average daily traffic volume at 50 percent of existing, 66 vehicles per day, in recognizing the Project provides 33 kilometers one-way travel distance savings between common places and prominent park and recreation destinations accessible via Rosy Canyon Road. Post-Project traffic volume counts indicate Rosy Canyon Road carrying 192 vehicles per day, which suggests 61 induced vehicles per day and total forecast traffic within 3 percent of actual. The 7.3 kilometers Project offers fuel savings at $2,000 USD per year to existing and $41,300 USD per year to induced road users based on average $0.74 USD per liter average local gasoline price.
2.2.2 Travel Time Savings
Travel time savings concern induced road users although existing facility users may receive albeit limited savings under significant change in operating speed subsequent to hard surfacing. User travel time value, a figure derived through examination of user type and local socioeconomic factors, underpins travel time savings calculation. The United States Department of Transportation recommends hourly values of travel time savings during in vehicle travel at $14.20 USD per person-hour for personal travel, $26.50 USD per person hour for business travel, and $14.80 USD per person-hour for all purposes in 2017 dollars [6]. The following expressions give annual road user benefit due to travel time savings.
- (existing average daily traffic volume) * (365 days/year) * (travel time savings to existing traffic in hours) * (average vehicle occupancy) * (local travel time value per person-hour)
- (induced average daily traffic volume) * (365 days/year) * (travel time savings to induced traffic in hours) * (average vehicle occupancy) * (local travel time value per person-hour)
Rosy Canyon Road hard surfacing provides only nominal benefit to existing and induced road users. This associated with Mohave County establishing 40 km/h regulatory speed limit on this curvilinear facility and the pre-existing, paved travel route navigating high-speed state highways.
2.2.3 Crash Reduction Savings
Crash reduction savings specific to hard surfacing proves plausible despite the improvement influencing traffic speed under increased surface friction. A University of Wyoming study evaluates traffic safety effect of changing road surface from gravel or dirt to asphalt through historical crash record analysis and field evaluation across three counties maintaining high percentage of local, gravel roads [7]. The study recommends the following crash reduction factor transferable to roads serving 35 to 1,468 average daily traffic and where the variable V denotes average daily traffic volume [8].
Crash Reduction Factor = 100 * (1 – e0.1123 – 0.0003V)
The aforementioned factor has application to all crash types and severity levels though crash reduction gives compelling monetary benefit under incidences of historical incapacitating injury and fatal crash occurrence. The United States Department of Transportation recommends monetized value of deaths at $9,600,000 USD and crashes irrespective of severity at $132,200 USD in 2017 dollars [6]. The following expressions compute annual road user benefit sourced to crash reduction savings as discerned from fatal crashes or all crashes.
- Fatal crash reduction: (historic rate of deaths per 100 million vehicle kilometers) * (crash reduction factor in percent / 100) * (existing average daily traffic volume) * (project distance in km) * (365 days/year) / (100,000,000) * (local monetized value of a death)
- Total crash reduction: (historic rate of crashes per million vehicle kilometers) * (crash reduction factor in percent / 100) * (existing average daily traffic volume) * (project distance in km) * (365 days/year) / (1,000,000) * (local monetized value of a crash irrespective of severity)
Rosy Canyon Road historical crash record review for the five-year period prior to hard surfacing indicates two injury crashes, and both events involved single-vehicle, run-off-road circumstance caused by speed too fast for conditions. In absence of high severity crashes or undue total crash rate, the Project does not qualify measurable crash reduction saving. No crashes have occurred through the one-year plus period since Rosy Canyon Road hard surfacing.
3. DESIGN
3.1 Service Life
Hard surfacing derives its structural strength and stiffness through soil stabilization and its resiliency through non-structural bituminous surface treatment. Soil stabilization considers mechanical techniques including placement and compaction of select fill, aggregate base course, and reclaimed asphalt millings. Bitumen, polymer, and other chemical stabilizers may further refine base course bearing capacity and provide moisture control. Herein contrasts hard surfacing and traditional asphalt or Portland cement concrete construction in that the surface course lends little to no structural support in hard surfacing application while targeting smooth and impervious function for rideability and subsurface protection.
A well-justified hard surfacing project will deliver 20-year service life to next (re)construction at total construction expense less than aggregate user benefits. Table 4 establishes practical hard surfacing design approach based largely on engineered pavement structural design standards adopted by Mohave County, which reference design policy and procedures set forth in the 1993 American Association of State Highway and Transportation Officials (AASHTO) Guide for Design of Pavement Structures [9]. These empirical design methods, as modified for efficient but conservative application, denote best practice approach toward successful hard surfacing works.
Table 4 – Hard Surfacing Design Approach
|
Component |
Procedure |
|
Service Life |
20 years |
|
Operational Structural Number “Demand” |
1. Use simplified equation to estimate cumulative two-directional 18-kip equivalent single axle loads (ESAL) sans vehicle classification data. • Wo(2-18) = [ADT * (% light-duty vehicles) * 0.004] + [ADT * (% heavy-duty vehicles) * 1.0] Where: Wo(2-18) represents daily two-directional 18-kip ESAL ADT = two-directional average daily traffic 2. Select traffic growth factor and AASHTO prescribed directional distribution and lane distribution factors to estimate total, future 18kip ESAL applications during service life period [9]. 3. Choose design variable values as follows or as suited to project conditions and target performance outcomes [9]. • Reliability Level = 80% • Overall Standard Deviation = 0.45 • Change in Serviceability Index = 2.2 4. Estimate Effective Roadbed Soil Resilient Modulus, MR. 5. Apply AASHTO nomograph for flexible pavements to determine structural number (SN) as per traffic load demand and performance outcomes through service life [9]. |
|
Design Structural Number “Supply” |
• Find AASHTO layer coefficient for base and, as applicable, subbase course materials comprising the stabilized subsurface structure [9]. • SN = (a2 * D2) + (a3 * D3) Where: a2 and a3 = base and subbase layer coefficients D2 and D3 = base and subbase thicknesses • Discount effect of drainage on base and subbase layers. • Determine base and subbase layer thicknesses yielding Design Structural Number at or above Operational Structural Number. |
Effective Roadbed Soil Resilient Modulus, MR, estimation deserves careful study in its application to hard surfacing design. Subsurface soil stabilization and its modest bearing capacity proves susceptible to roadbed soil characteristics as summarized in Table 1. As alternative to rigorous geotechnical sampling and testing, the literature provides reasonable MR estimation from soil classification systems including AASHTO and Unified Soil Classification System (USCS) [10]. Mohave County confirms this correlation through its evaluation of roadbed soils performance under assigned AASHTO and USCS soil groups from laboratory tests and published soils maps. Typical MR value for roadbed soils range downward at MR = 29 kip per square inch (ksi) or 200 megapascal (MPa) for gravelly, MR = 18 ksi (124 MPa) for sandy, and MR = 8 ksi (55 MPa) for silty/clayey soils. Table 5 presents Operational Structural Number by roadbed soil textural type in accordance with Table 4 procedure for a range of design 18-kip ESAL applications. This analysis punctuates roadbed soil effect on design for structural strength and stiffness as typical silty/clayey and sandy roadbed soils invoke 65 percent and 22 percent increased structural demand, respectively, than typical gravelly roadbed soils.
Table 5 – Operational Structural Number by Roadbed Soil Textural Type
|
Traffic Load |
Operational Structural Number |
||
|
Gravelly |
Sandy |
Silty/Clayey |
|
|
1,000,000 ESAL |
1.89 |
2.26 |
3.03 |
|
500,000 ESAL |
1.68 |
2.02 |
2.73 |
|
100,000 ESAL |
1.25 |
1.54 |
2.12 |
|
50,000 ESAL |
1.09 |
1.36 |
1.89 |
3.2 Materials
3.2.1 Stabilizer
Mohave County commands extensive experience on soil stabilizer performance. This includes cutback asphalt and polymer emulsion use in past soil stabilization and hard surfacing work. Qualities fundamental to stabilizer performance concern penetration and cohesion to the prepared base course. The County, through its Public Works Department, made notable findings in laboratory testing and examination of core samples from past works in assessing cutback asphalt, asphalt emulsion, and polymer emulsion as candidate stabilizers for Rosy Canyon Road application. Having not used asphalt emulsions, a common chip seal binder, in hard surfacing work, the County tested stabilizer penetration using core samples retrieved from recent soil stabilized base courses on County roads to assess performance expectation. As such, findings show this bitumen formulation provides inadequate, approximately 3 mm penetration as exhibited in Figure 3.
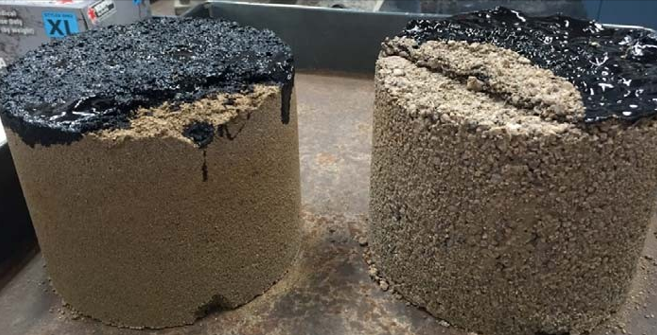
Figure 3 – Asphalt Emulsion Penetration Performance
Rosy Canyon Road stabilizer selection derives from core sample evaluation on long-term polymer emulsion and cutback asphalt performance. This evaluation references hard surfacing works completed approximately 8 years prior to core sample extraction. Figure 4 illustrates polymer emulsion performance under roadbed soil application with protective chip seal surface treatment, which indicates the stabilizer degrades over time. This loss of cohesive soil bond significantly detracts from long-term stability of the hard surfacing work.
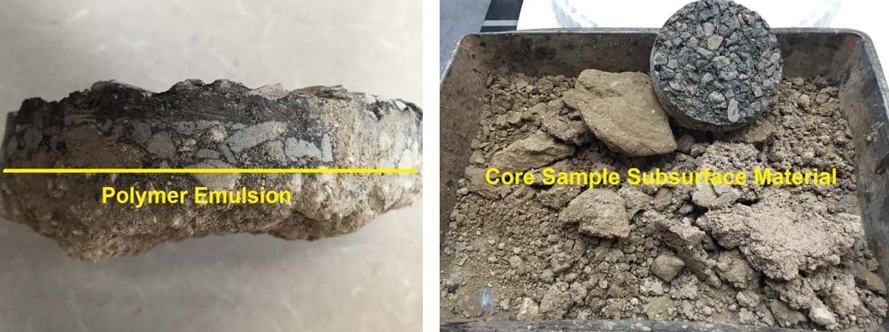
Figure 4 – Polymer Emulsion Long-Term Cohesion Performance
Cutback asphalt, commonly MC-250, demonstrates sound penetration depth at approximately 2.5 cm, and core sample assessment confirms base course rigidity sustained in the long-term. Figure 5 shows characteristic MC-250 cutback asphalt penetration in a subsurface stabilizing capacity. Rosy Canyon Road hard surfacing uses cutback asphalt as stabilizer, and this bitumen formulation doubles as chip seal surface treatment binder in executing the Project’s penetration chip seal construction method.
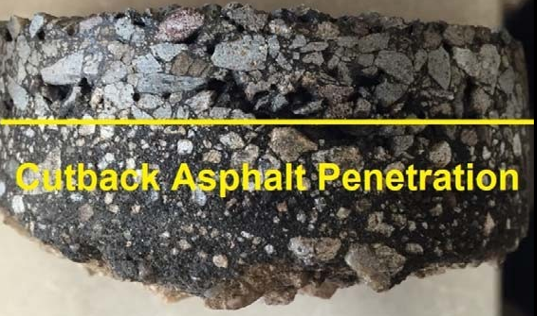
Figure 5 – Cutback Asphalt Long-Term Penetration Performance
3.2.2 Subbase and Base
Rosy Canyon Road subsurface stabilization reflects rigorous review and engineering consistent with the discussed methodologies toward assuring Project long-term performance. NRCS soil maps infer roadbed soils dominantly consist of silty sand, a USCS SM group soil, with approximate 18 percent remaining balance of silty clay, a USCS CL-ML group soil. Correlating MR as weighted average of roadbed soil composition through the Project approximates at 19 ksi (131 MPa). Mohave County’s access to select granular fill and specification-grade aggregate near Rosy Canyon Road drove its mechanical soil stabilization approach to achieve Design “Supply” Structural Number exceeding Operational “Demand” Structural Number over 20-year Project service life. The select fill, a silty clayey gravel laboratory graded as USCS GC-GM group soil, constitutes Project subbase course at minimum 20 cm thickness. Figure 6 highlights County forces transporting, placing, and compacting the subbase in advance of contractor delivered base course construction, stabilization, and hard surfacing. Aggregate base course meets County adopted Maricopa Association of Governments (MAG) Specification 702 for base materials [11]. Base course material represents USCS GP-GM group soil placed at minimum 10 cm thickness.
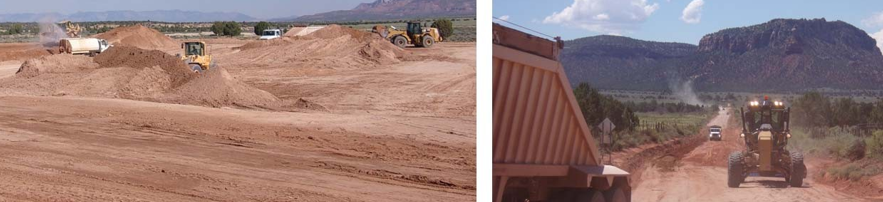
Table 6 summarizes calculations applied in Rosy Canyon Road base and subbase design. It demonstrates subsurface strength and stiffness as-constructed will reasonably support forecast traffic load during the Project’s 20-year service life.
Table 6 – Soil Stabilization Design
|
Operational Structural Number |
Design Structural Number |
|
1. Service life = 20 years 2. Forecast average daily traffic = 197 vpd (192 vpd actual) 3. Forecast ADT growth = 3% per year 4. Percent heavy-duty vehicles = 11.4%; sourced to connecting state highway (Arizona Route 389) published data 5. Cumulative two-directional 18-kip ESAL = 23.2/day 6. Directional distribution factor = 0.7; sourced to Mohave County traffic volume data 7. Lane distribution factor = 1.0 8. Estimated total 18-kip ESAL during service life period = 160,000 ESAL 9. Roadbed MR = 19 ksi (131 MPa) 10. Operational SN = 1.63 |
1. Base material resilient modulus, EBS = 26 ksi (179 MPa); sourced to base USCS group and estimation from literature [10] 2. AASHTO base layer coefficient, a2 = 0.12; sourced to AASHTO published relationship between EBS and a2 [9] 3. Base layer thickness, D2 = 4 inches (10 cm) minimum 4. Subbase material resilient modulus, ESB = 25 ksi (172 MPa); sourced to subbase USCS group and estimation from literature [10] 5. AASHTO subbase layer coefficient, a3 = 0.16; sourced to AASHTO published relationship between ESB and a3 [9] 6. Subbase layer thickness, D3 = 8 inches (20 cm) minimum 7. Design SN = (0.12 * 4) + (0.16 * 8) = 1.76 |
Design Structural Number (1.76) > Operational Structural Number (1.63)
![]()
4. IMPLEMENTATION
Rosy Canyon Road hard surfacing spanned three phases: (1) Mohave County Public Works placing subbase in advance of County contractor, (2) constructing base course and (3) performing penetration chip seal. The Project commenced on 21 August 2017 and completed on 10 November 2017 with 17-day hiatus between County and contractor transition. Its timing factored desert summer monsoon season end and ambient temperature sufficient to support quality bituminous stabilizer and chip seal binder work. Table 7 encapsulates overall Project delivery and key characteristics in its execution. Costs reflect United States dollars, and County expense incurred under Phase 1 pertain to direct mobilization, water, and select equipment rental expense only as Mohave County Public Works dedicated staff labor and largely County-owned equipment to subbase activities. Additional County work concurrent to Phase 1 and contributing to its period of performance involved culvert cross drain and cattle guard replacement through the Project limits.
Table 7 – Project Implementation Summary
|
Phase |
Cost |
Characteristic |
|
1
Subbase Course |
$32,155 |
• 20 cm average subbase course thickness • Compaction at 95% of maximum density • Subbase material pre-wet at haul site • Material transport by belly dump and end dump trucks • Placement by motor grader • Compaction by pneumatic roller and water truck |
|
2
Base Course |
$394,728 |
• 10 cm average base course thickness • Compaction at 95% of maximum density • Material transport by belly dump truck • Placement by motor grader and grade tractor • Compaction by steel roller and water truck |
|
3
Penetration and Chip Seal |
$176,186 |
• MC-800 medium curing cutback asphalt • MAG Specification 716 chip seal aggregate for high volume roads [11] • Aggregate spread rate at 29 pounds per square yard (15.7 kg/m2) • Bitumen application rate at 0.50 gallons per square yard (2.26 l/m2) |
Chip seal aggregate consists of robust 8 mm median particle size spread at rate determined through the well-recognized McLeod chip seal design procedure [12]. Aggregate gradation sports impressive uniform size ideal for chip seal work. Project samples indicate average 74 percent of product representing size between 0.375-inch (9.51 mm) and 0.25-inch (6.35 mm) sieve opening. MC-800 cutback bitumen application rate for chip seal follows McLeod’s procedure, established at 0.24 gallons per square yard (1.09 l/m2). Product balance, 52 percent, performs to penetrate and stabilize the underlying base course. MC-800 contains 80 percent bitumen, and it has over triple average kinematic viscosity, 800 – 1,600 mm2/s, to MC-250 for better response when applied under Project ambient temperatures at 16° Celsius minimum. Its medium curing property gives extended working time prior to break and further lends to improved adhesion to finer particles in the stabilized base course. Figure 7 captures Rosy Canyon Road hard surfacing progress milestones.
5. CONCLUSION
Hard surfacing delivers broad benefits to road users and elevates community quality of life. It proves programmatic in improving access, critical to emergency services and commerce, and fosters development of added transportation services and choices demanding hard surfaced roads. Underserved communities realize new opportunities for multimodal transport and economic growth while enjoying an environmentally sustainable transportation facility through improvements eliminating a significant source of particulate matter pollution from passing traffic releasing airborne dust particles. Current and induced road users see benefits through mobility, travel time reliability, and safety in addition to vehicle operation cost via better fuel economy and less vehicle wear.
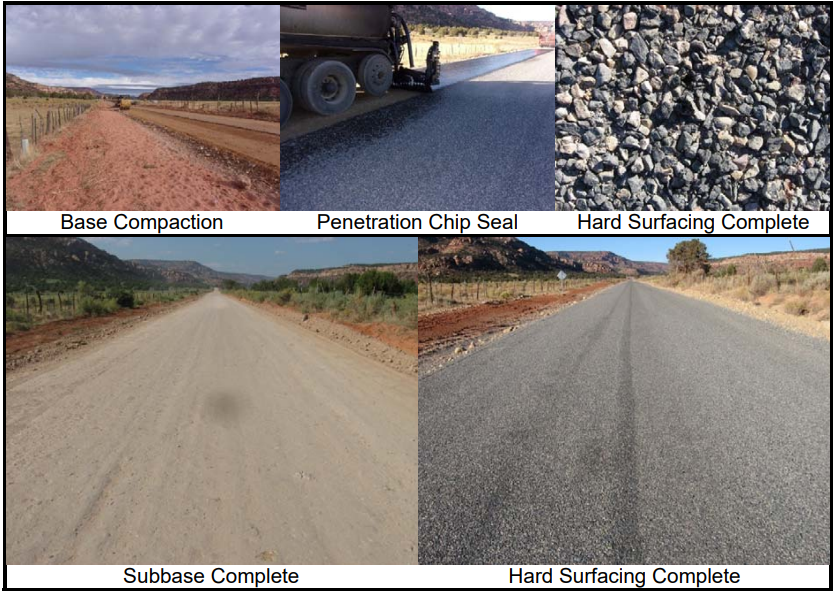
Figure 7 – Rosy Canyon Road Hard Surfacing Progress Milestones
Rosy Canyon Road hard surfacing underscores the Project’s overarching goal in creating an all-weather, resilient road driving its plethora of benefits. The quantifiable, monetary benefit of road user fuel savings alone tops Project investment. At 20-year service life and 3 percent discount rate, Project benefit absent of numerous livability and economic benefit considerations exceeds Project cost. Figure 8 presents facility condition in January 2019, 14 months after hard surfacing and subsequent to Mohave County Public Works chip seal preventive maintenance work in May 2018.
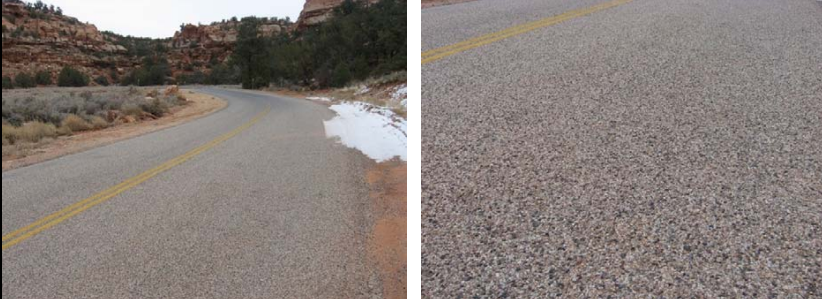
Figure 8 – Rosy Canyon Road Present Condition
REFERENCES
1. NRCS (2018). Web Soil Survey. United States Department of Agriculture, National Resources Conservation Service. Web. 2 Dec. 2018. <https://websoilsurvey.sc.egov.usda.gov>.
2. ASTM International (2017). ASTM D2487-17, Standard Practice for Classification of Soils for Engineering Purposes (Unified Soil Classification System). West Conshohocken, PA, USA.
3. Willis, J.R., Robbins, M.M., Thompson, M. (2015). Effects of Pavement Properties on Vehicular Rolling Resistance: A Literature Review. Report No. 14-07. National Center for Asphalt Technology, Auburn University, Auburn, AL, USA.
4. USDOE (2018). Alternative Fuels Data Center (2018). United States Department of Energy. Web. 6 Dec.
2018. <https://afdc.energy.gov/conserve/fuel_economy_tires_light.html>.
5. IEA (2018). Fuel Economy of Cars and Vans. International Energy Agency. Web. 6 Dec. 2018.
<https://www.iea.org/tcep/transport/fueleconomy>.
6. USDOT (2018). Benefit-Cost Analysis Guidance for Discretionary Grant Programs. United States Department of Transportation, Washington, DC, USA.
7. Ksaibati, K., Zhong, C., Evans, B. (2009). WRRSP: Wyoming Rural Road Safety Program. Report No. FHWA-WY-09/06F. Wyoming Department of Transportation, Cheyenne, WY, USA.
8. FHWA (2018). Crash Modification Factors Clearinghouse. United States Department of Transportation Federal Highway Administration. Web. 7 Dec. 2018. <http://www.cmfclearinghouse.org>.
9. AASHTO (1993). AASHTO Guide for Design of Pavement Structures. American Association of State Highway and Transportation Officials, Washington, DC, USA.
10. NCHRP (2001). Guide for Mechanistic-Empirical Design of New and Rehabilitated Pavement Structures. Appendix CC-1: Correlation of CBR Values with Soil Index Properties. National Cooperative Highway Research Program, Transportation Research Board, Washington, DC, USA.
11. MAG (2018). Uniform Standard Specifications and Details for Public Works Construction. Maricopa Association of Governments, Phoenix, AZ, USA.
12. McLeod, N. W. (1969). Seal Coat Design. Proceedings of the Association of Asphalt Paving Technologists, Vol. 38.