Final 2023 Housing Study & Needs Assessment Report

Mohave County Housing Needs
Assessment
Report

September 2023

The Mohave County Housing Needs Assessment (HNA) examines current housing conditions, forecasts long-term housing needs, and identifies potential policies that support a fair and equitable housing environment. The overall goal of the Housing Needs Assessment is to help focus community efforts on the most critical local housing issues. Specifically, the report focuses on four key objectives:

  1. Identify housing needs to address expected growth over the next two decades, including needs for affordable housing in Mohave County and northern La Paz County.
  2. Obtain input from local residents, housing developers, builders and local officials regarding major housing issues and ideas for fostering housing development.
  3. Provide an interactive mapping tool for identifying potential future housing development sites.
  4. Provide a guide for developing local housing policies, programs, and strategies.

Key findings:

  • Arizona had the 8th fastest population growth rate in the nation since the pandemic (2021- 2022) with an annual growth rate of 1.7%. During this same period, Mohave County’s population increased even faster at 2.1% per year.
  • Mohave County and northern La Paz County are projected to add over 75,000 new residents over the next 20 years. • Income levels in Mohave County remain well below statewide averages, but have risen substantially over the last decade.
  • Nearly 17% of the renter households in Mohave County spend over half of their household income which compares favorably to Arizona as a whole (21%).
  • Local poverty rates are higher in Mohave County (18.2%) compared with Arizona (12.8%).
  • The current housing inventory in Mohave County is very tight with vacancy rates estimated at 1%.
  • It is estimated that 1 in 5 homes in Mohave County are used as second/seasonal homes. The second home inventory represents 23,714 housing units in Mohave County.
  • The income restricted affordable housing inventory includes 1,075 Low Income Housing Tax Credits (LIHTC) units in Mohave County.
  • Current housing developments in Mohave County include at least 12 major subdivisions with over 1,000 housing units planned or under construction.
  • Major new business investments are also being planned. Mohave County staff are tracking 12 large business location/expansion projects that are expected to employ 4,000 to 5,000 workers over the next 4 to 10 years.

Housing Needs and Policy Considerations

Citizens and housing developer/lender input was conducted as part of this study and received more than 800 responses. Respondents identified housing affordability and availability of quality rental housing as the biggest issues to be addressed.

The local housing market is expected to remain strong with demand for over 50,600 housing units by year 2045. This equates to an annual average absorption of between 2,000 and 2,300 units per year. Short-term demand could even be higher with a current need for 8,200+ rentals or subsidized housing units to accommodate current pent-up demand for apartments. This study identified and evaluated potential LIHTC sites throughout Mohave County. The County should continue to work with local cities to advance new LIHTC developments.

Projected Net New Housing Needs by Type and Location: 2022-2045

housing needs projections 2023-2024

Input from developers, contractors, lenders and affordable housing advocates reflect current perceptions regarding the “Top 3 barriers to affordable housing development” and “Top 3 actions for local policy officials to consider.” A list of best practices for fostering housing developments is included in this study as a resource for Mohave County as well as Lake Havasu City, Bullhead, Colorado City and Parker to consider. 

TOP 3 BARRIERS TO AFFORDABLE HOUSING

  1. Construction Costs
  2. Cost of Infrastructure
  3. Contractor Availability 

TOP 3 LOCAL POLICY CONSIDERATIONS

  1. Create tax incentives for affordable housing developments
  2. Encourage Master Planned Developments
  3. Create Public-Private Partnerships  

This work is made possible through the dedicated work of the Housing Advisory Committee and county and city staff. We specifically recognize and appreciate the time and input provided by the following people: 

Mohave County Staff 
Michael Smith, Mohave County 
Barbara Spoonhour, Mohave County 
Chanania "Nay" Rush, Mohave County 
Rachael Thompson, Mohave County 
Tami Ursenbach, Mohave County 
Scott Holtry, Mohave County 
Steven Engle, Mohave County 
Sam Elters, Mohave County 

Stakeholder Advisory Committee Members 
Stacy Klippenstein, Mohave Community College 
Carolyn Stewart, Bullhead City School District 
Tommy Taylor, Mohave/La Paz Workforce Development Board 
Tyler Angle, Angle Homes 
Jeff Thuneman, Lake Havasu City 
Becky Fawson, Kingman Chamber of Commerce 
Megan Spielman, La Paz County 
Skip Becker, Becker Development 
Freddy Watahomigie, Hualapai Tribe 
Justin Frances, Hann Development 
Deb Pennington, United Way 
Lisa Van Ella, Clearinghouse 
Jeanne Kentch, Mohave County Assessor 

Project Consultants 
Todd Chase, FCS GROUP 
Tim Wood, FCS GROUP 
Steve Faust, 3J Consulting 
Julia Reisman, 3J Consulting  

Accessory Dwelling Unit (ADU): A small living space located on the same lot as a single-family house.

Affordable For-Sale Housing: An owner-occupied dwelling with an annual housing cost (mortgage payments, utilities, property taxes, etc.) that equates to no more than 30% of household income.

Affordable Rental Housing: A dwelling that is rented by a person or household whose monthly housing costs, including utilities other than telephone, do not exceed 30% of the household's monthly income. If income-restricted or government supported, U.S. Housing and Urban Development (HUD) income restrictions vary by family size.*

*A healthy housing market includes a variety of housing types that are affordable to a range of household income levels. However, the term “affordable housing” is often used to describe income- restricted housing available only to qualifying low-income households. Income-restricted housing can be located in public, non-profit or for-profit developments. It can also include housing vouchers to help pay for market-rate housing (see “Vouchers” below for more details).

American Community Survey (ACS): This is an ongoing nationwide survey conducted by the U.S. Census Bureau. It is designed to provide communities with current data about how they are changing.

Area Median Income (AMI): This term refers to area-wide median family income calculations provided by the federal Department of Housing and Urban Development (HUD) for a county or region. Income limits to qualify for affordable housing are often set relative to AMI in this report, unless otherwise indicated.

Buildable Lands Inventory (BLI): An assessment of the capacity of land to accommodate forecasted housing and employment needs.

Buildable Residential Land: Includes land that is designated for residential development that is vacant and part-vacant and not constrained by existing buildings or environmental issues.

Rent Burdened: Defined by U.S. Department of Housing and Urban Development (HUD) as households who spend over 30% of their income on rent.

Cottages: Small, single-level, detached units, often on their own lots and sometimes clustered around pockets of shared open space. A cottage is typically under 1,000 square feet in footprint. Density: Defined by the number of housing units on one acre of land.

Development Density: Expected number of dwelling units (per acre) based on current zoning designations.

Fair Market Rent (FMR): HUD determines what a reasonable rent level should be for a geographic area and sets this as the areas FMR. Housing choice voucher program holders are limited to selecting units that do not rent for more than fair market rent.

Family: A group of two or more people (one of whom is the householder) related by birth, marriage, or adoption and residing together. 

Group Quarters: People living in shared housing facilities, such as a college dormitory, military barrack, nursing home or temporary shelter, are not considered households and are counted as group quarters population.  

High Density: Lots with the average density of 12+ dwelling units per acre. Best suited for multifamily housing, such as apartments and condominiums.  

Housing Unit (or Dwelling Unit): A house, an apartment or other group of rooms, or a single room, is regarded as a housing unit when it is occupied or intended for occupancy as separate living quarters; that is, when the occupants do not live and eat with any other person in the structure and there is direct access from the outside or common hall. 

Household: Consists of all people that occupy a housing unit. The people can be related, such as a 
family, or unrelated. A person living alone is also a household.  

HUD: Acronym for U.S. Department of Housing and Urban Development, the federal agency dedicated to 
strengthening and supporting the housing market.  

Low Density: Lots with an average density of 3-5 dwelling units per acre. Best suited for family 
housing such as single-family detached homes. 

Low-Income: Families designated as low-income may qualify for subsidized housing and/or income-based deed-restricted housing units. HUD classifies families based on median family income levels as shown below: 

Income Category Household Income*
Extremely low-income 30% of MFI or less
Very-low income 30-50% of MFI
Low income 50-80% of MFI
Moderate income 80-100% of MFI
Above median income > 100% of MFI

*Median Family Income (MFI) for the HUD defined market area.

Low Income Housing Tax Credits (LIHTC): Created by the Tax Reform Act of 1986, the LIHTC program gives State and local LIHTC-allocating agencies the equivalent of approximately $9 billion in annual budget authority to issue tax credits for the acquisition, rehabilitation, or new construction of rental housing targeted to lower-income households. 

Manufactured Housing: A type of prefabricated home that is largely assembled of site and then transported to sites of use. The definition of the term in the United States is regulated by federal law (Code of Federal Regulations, 24 CFR 3280): "Manufactured homes are built as dwelling units of at least 320 square feet in size, usually with a permanent chassis to assure the initial and continued transportability of the home. The requirement to have a wheeled chassis permanently attached differentiates "manufactured housing" from other types of prefabricated homes, such as modular homes.  

Median Family Income (MFI): The median sum of the income of all family members 15 years and older living in the household. Families are groups of two or more people (one of whom is the householder) related by birth, marriage, or adoption and residing together; all such people (including related subfamily members) are considered as members of one family. Median income of non-family households tends to be lower than for family households. In this report, both MFI and AMI refer to the U.S. Department of Housing and Urban Development Area Median Family Income (AMI) unless otherwise specified.  

Medium Density: Lots with the average density of 6-12 dwelling units per acre. Best suited for small lot housing such as single family attached, townhomes, plexes and cottages. 

Middle Housing: Housing types that are generally attainable for households earning less than 120% of the area median income level. Typically includes plexes (2-4 units per structure), townhomes, apartments,accessory dwellings, cottage homes and manufactured homes. 

Mixed Use: Characterized as two or more residential, commercial, cultural, institutional, and/or industrial uses into one combined building or building(s) on the same parcel of land. 

Multi-Family Housing: Stacked flats in a single buildings or groups of buildings on a single lot with 5 or more units per structure. Parking is shared, and entrance to units is typically accessed through a shared lobby. 

Part-Vacant Land: Unconstrained land that has some existing development but can be subdivided to allow for additional residential development. 

Permanent Resident Population: This refers to the count of all people (citizens and noncitizens) who are living in the location at the time of the census. People are counted at their usual residence, which is the place where they live and sleep most of the time. 

Plexes: two to four separate dwelling units within one structure on a single lot. In most instances each duplex, triplex or quadplex unit has its own separate entry.

Residual Land Value: The amount a developer would typically be willing to pay for the land/site in order to build a specific real estate improvement, based on underlying assumptions and market conditions. 

Seasonal Dwellings: These units are intended by the owner to be occupied during only certain seasons of the year. They are not anyone’s usual residence. A seasonal unit may be used in more than one season; for example, for both summer and winter sports. Published counts of seasonal units also include housing units held for occupancy by migratory farm workers. While not currently intended for year-round use, most seasonal units could be used year-round. 

Severely Cost Burdened: Defined U.S. Department of Housing and Urban Development (HUD) as households who spend over 50% of their income on housing.

Single Family Attached: Residential structures comprised of two to four housing units with a shared wall that separates each unit. “Attached” duplexes require a single building permit for both dwelling units.

Single Family Detached: Free standing residential building, unattached, containing separate bathing, kitchen, sanitary, and sleeping facilities designed to be occupied by not more than one family, not including manufactured and mobile homes.  

Subsidized Housing: Public housing, rental assistance vouchers, and developments that use Low-Income Housing Tax Credits (LIHTC) are examples of subsidized housing. Subsidized housing lowers overall housing costs for its occupants. Affordable housing and subsidized housing are different even though the terms are sometimes used interchangeably.  

Tenure: Tenure refers to the ownership of the housing unit in relation to its occupants. According to the U.S. Census Bureau, a housing unit is “owned” if the owner or co-owner(s) live in the unit, even if it is mortgaged or not fully paid for. A cooperative, condominium or mobile home is “owned” only if the owner or co-owner lives in it. All other occupied housing units are classified as “rented.” 

Townhome (also known as duplexes, rowhouse, etc.): Attached housing units, each on a separate lot, and each with its own entry from a public or shared street or common area. 

Unstably Housed: Any individual or family who: 1) Is at-risk of losing their housing; 2) Have been notified to vacate current residence or otherwise demonstrate a risk of losing current housing; and 3) Lacks the resources or support networks to obtain other permanent housing. 

Vacant Housing Unit: A housing unit is vacant if no one is living in it at the time of enumeration unless its occupants are only temporarily absent. Units temporarily occupied at the time of enumeration entirely by people who have a usual residence elsewhere are also classified as vacant. 

Vacant Land: Vacant and part-vacant land identified within the local buildable land inventory that is not developed and unconstrained for future planned residential development. 

Vouchers (Tenant-based and Project-based): HUD provides housing vouchers to qualifying low-income households to off-set a portion of their rents. These are typically distributed by local housing authorities. Vouchers can be “tenant-based,” meaning the household can use them to help pay for market-rate housing in the location of their choice. The tenant pays the difference between the fair market rent and 30% of the tenant’s income, or vouchers can be “project-based,” meaning they are 
assigned to a specific building.  

Purpose

Communities across the nation are facing unprecedented challenges in providing safe and affordable housing for people at all income levels. In response, Mohave County continues to pursue policies and planning activities aimed at understanding housing needs and implementing local actions to preserve affordable housing and foster additional housing development.  

The Mohave County Housing Needs Assessment (HNA) examines current housing conditions, forecasts long-term housing needs, and identifies potential policies that support a fair and equitable housing environment. The HNA process included a review of current land use and public facility plans, and local development regulations to determine existing conditions and perceived barriers to new development. Community input through stakeholder surveys and meetings with the Housing Advisory Committee (HAC) served to identify issues and to discuss potential policies designed to increase production of affordable and market-rate housing.  

The overall goal of the Housing Needs Assessment is to help focus community efforts on the most critical local housing issues.  

The Mohave County Housing Needs Assessment is intended to identify long-term housing needs, and to analyze and recommend strategies that will help foster new housing opportunities for households of all income levels. The policies and practices discussed in this report are intended to build upon the efforts already undertaken by Mohave County. 

Regional Context

Because housing markets are rarely contained within a single jurisdiction, a regional perspective is necessary to understand the interaction between housing supply and demand. For example, if safe and affordable housing is not sufficient in one community, people will search for housing in nearby jurisdictions rather than leave the region, altogether.  

The focus of this HNA is on Mohave County and La Paz County, which includes Kingman, Bullhead City, Lake Havasu City, and Colorado City, as well as relatively rural, unincorporated areas of Mohave County. The study also includes Parker, a community in northern La Paz County. While Mohave County, overall, is relatively rural in nature, the proximity to Las Vegas, Nevada, and other major cities, has made it an attractive destination for people who want to escape the high cost of living in urban areas. As discussed later in this report, Mohave County and northern La Paz County have seen an influx of new residents and second-home buyers for over a decade. 

Like much of Arizona, a rapid influx of demand from “second homeowners” and “real estate investment entities” has outpaced housing production, which has, in-turn, driven up housing costs and rents for local residents and has created a significant housing shortfall.   

The four main objectives of the Housing Needs Assessment:

  1. Evaluate housing options and calculated housing needed to accommodate population growth between now and 2045 and identify the highest needs for affordable housing in Mohave County and northern La Paz County.
  2. Inform the community on its housing needs.
  3. Provide a useful interactive mapping tool for identifying potential future housing development sites.
  4. Provide a guide in developing appropriate housing policies, programs, and strategies.  


Figure 1. Housing Analysis Study Area


Approach

The process used to create this report is illustrated in the following graphic and included:

  • Data Synthesis to account for current vacant and part-vacant lands that are designated for future residential development. The data was compiled using Geographic Information Systems (GIS) to map and quantify potential housing future development locations throughout Mohave County, and to account for significant environmental features and potential development constraints.
  • Housing Needs Analysis based on current housing market gaps, key demographic and socio- economic trends, and a range of low, medium and high population growth forecasts, to determine housing needs over the next 20 years. These projections also included affordability considerations for at-risk subpopulation groups.
  • Economic and Infrastructure Assessment of commute patterns of local workers and residents, and current economic conditions. Public utility providers were interviewed, and facility master plans were reviewed, to determine the general sufficiency of water, sanitary sewer, and power infrastructure required to accommodate projected housing demand.
  • The Housing Policy Assessment included a review of current local housing policies and identification of potential regulatory and financial incentives that the County and cities should consider for increasing the affordable housing supply.
  • Community Engagement with input from local developers, residents, real estate lenders, builders, and brokers that are actively involved in the housing market. Outreach surveys were conducted for both residents and stakeholders.

HNA work plan approach

Population

Mohave County continues to set yearly record high population levels and has added nearly 1,800 residents, annually, since the year 2010. According to the Arizona Commerce Authority, there were 221,105 people living in Mohave County in 2022 up from 220,792 in 2021. Several factors, including broader regional in-migration, increasing share of people working remotely and favorable cost of living are driving up population growth in Mohave County.

According to the U.S. Census, Arizona had the 8th fastest population growth rate since the pandemic (2021-2022) with an annual growth rate of 1.7%. During this same period, Mohave County’s population increased by 2.11% — much faster than the state average (Exhibit 1).

The City of Lake Havasu City (pop. 58,506) is the largest city in Mohave County. Other cities include Bullhead City (pop. 42,601), Kingman (pop. 34,669) and Colorado City (pop. 2,534). The unincorporated portions of Mohave County account for 37% of the total residents (pop. 82,795).

Exhibit 1: Population Trends (2000-2021)* 

Population Trends 2000 2010 2020 2021 2022 Long term
AGR (2000-2022)
Post Pandemic
AGR (2021-2022)
Arizona 5,175,581 6,398,985 7,176,401 7,285,370 7,409,089 1.64% 1.70%
Mohave County 161,403 200,186 218,321 216,527 221,105 1.44% 2.11%
Bullhead City 34,563 39,521 41,452 42,027 42,601 0.95% 1.37%
Colorado City 3,801 4,740 2,478 2,507 2,534 -1.83% 1.08%
Kingman 21,213 28,104 32,865 33,716 34,669 2.26% 2.83%
Lake Havasu City 44,127 52,473 57,331 57,974 58,506 1.29% 0.92%
Unincorporated 57,700 75,133 79,859 80,303 82,795 1.65% 3.10%
La Paz County 19,903 20,489 20,341 16,820 16,860 -0.75% 0.24%
City of Parker 3,139 3,089 3,428 3,431 3,434 0.41% 0.09%
Parker Strip CDP n/a 662 757 760 n/a 1.26% n/a

Source: Arizona Commerce Authority and U.S. Census, American Community Survey, 2022. 
AGR: Compound Annual Growth Rate.  CDP: Census Defined Place.

Note regarding U.S. Census data issues for Colorado City per RARE Report: “As is common among many underserved or marginalized communities, the 2020 Census grossly undercounted the population in many areas. This is because despite the changes and growth, the historical, community, and family trauma has not been eradicated. Lingering fear of government and conspiracy concerns are daily conversations among many. The undercount was, of course, exacerbated by the pandemic, by the inadequate time allowed, and by a shortage of census workers. But the endemic distrust of government influenced the lack of online response to the census link as well as the disinclination of many residents to respond to in-person workers.”

A June 2022 article in the Arizona Republic addressed this issue noting that “Colorado City saw fewer than one in three households complete the census themselves.” This is a smaller percentage than in Arizona as a whole and one of the lowest of any city or town in the state. The 2020 census counted nearly 2,500 people living in the town, but population estimates for the year before showed a population nearly twice as large. The percentage difference between Colorado City’s estimates and counts is larger than the gap for any other city or town in Arizona.” (Geoff Hing, Arizona Republic: Why these Arizona towns are questioning their census counts and the revenue they direct Published 6:45 a.m. MT June 28, 2022) In contrast to the Census numbers, on the ground observation shows that the population between 2019- 2020 did not decrease, but in fact grew. One of the telling factors is that all the Trust homes that were vacant in 2019 were full by the end of the year. And school enrollment increased by 11% at Water Canyon public school (Washington County) and by 29% at El Capitan public school (Mohave County) between those years. And this doesn’t factor in the growth in homeschooling and private schools during this time.”

The median age of Mohave County residents (52.3) has increased over the last decade and is higher than the statewide average (38.1). Bullhead City (51.5) and Lake Havasu City (54.8) are near the countywide average age, while Kingman (41) and Colorado City (17.8) are lower than the Countywide average (Exhibit 2).

Exhibit 2: Median Age 2010-2021

Exhibit 2: Median Age 2010-2021

The largest ethnic group in Mohave County is the Hispanic/Latino segment, which accounts for 17% of countywide population — lower than the statewide average (32%). Bullhead City (24%), Kingman (19%), and Parker (55%) each have a higher share of Hispanic/Latino population relative to the County, while Lake Havasu City (15%) and Colorado City (0%) have a lower share (Exhibit 3).

Exhibit 3: Population Identifying as Hispanic or Latino, 2021 

Population Identifying as Hispanic or Latino, 2021

Average Household size in Mohave County (2.2) has decreased over the last decade and remains lower than the statewide average (2.6). Bullhead City (2.2), Kingman (2.2), and Lake Havasu City (2.1) are near the countywide average age, while Parker (2.5) and Colorado City (5.4) are higher than the Countywide average (Exhibit 4).

Exhibit 4: Average Household Size 

Exhibit 4: Average Household Size

Group quarters population reflects the share of people living in institutionalized settings such as dorms, prisons, and cognitive care establishments. The share of Mohave County residents living in group quarters (1.3%) is slightly lower than the statewide average (2%) (Exhibit 5). The City of Kingman has the largest group quarters share (4.2%) followed by the City of Parker (2.8%) in La Paz County. Bullhead City, Lake Havasu City and Colorado City recorded minimal amounts of group quarters population.

Exhibit 5: Group Quarters Population 

Exhibit 5: Group Quarters Population

Income levels in Mohave County continue to be well below statewide averages, but have risen substantially over the last decade, keeping pace with statewide income growth rates (Exhibit 6). Median income for households increased in Bullhead City ($43,368 up from $36,549), Kingman ($52,768 up from $43,849), Lake Havasu City ($59,817 up from $43,647), and Parker ($59,872 up from $42,961). Income data for Colorado City was not reported by the U.S. Census.

Exhibit 6: Median Household Income, 2010, 2021 

Exhibit 6: Median Household Income, 2010, 2021

Housing Cost Burdens

According to U.S. Housing and Urban Development (HUD), households are considered to be “rent burdened” if they pay over 30% of their income on rent and related utilities, and “severe rent burden” occurs when over 50% of income is paid in rent. As shown in Exhibit 7, nearly 17% of the renter households in Mohave County were severely rent burdened in 2021 which compares favorably to Arizona as a whole (21%). Recently, housing cost burdens have increased. Between 2020 and 2023, household incomes in Mohave County increased by 13.3%, while median rents increased by 24.9% (according to data from the U.S. Census and Zillow.com).

Exhibit 7: Severe Rent Cost Burden, Mohave County 

Exhibit 7: Severe Rent Cost Burden, Mohave County

It should be noted that there are other factors that impact overall “affordability” beyond house rent/price and number of bedrooms. Costs are also inherent for neighborhood and school quality, public safety, and access to jobs and amenities. The percentage of income dedicated to housing may not fully consider the effects of housing and neighborhood quality. As such, housing may appear affordable based upon cost alone, but for example, if that housing is located far from employment centers, there will be an increase in household income dedicated to transportation. A household may choose a low-quality housing unit or a low-opportunity neighborhood to reduce housing costs.

As a result, the conventional measure of affordable housing likely underestimates the number of households who are burdened by combined housing and transportation costs as well as the number of households in need of quality affordable housing.

Like many rural communities across the U.S., an increasing share of Mohave County households are experiencing economic hardship as the overall cost of living rises faster than income levels.

Since the War on Poverty began in 1965, the Federal Poverty Level (FPL) has provided a standard for determining the proportion of people living in poverty in the U.S. The FPL provides a nationally recognized income threshold for determining the depths of poverty in a given community.

In 2021, 18.2% of the households in Mohave County were living in poverty which is well above the statewide average of 12.8% (Exhibit 8). 

Exhibit 8: Share of Population in Poverty, 2021 

Exhibit 8: Share of Population in Poverty, 2021

Other recent Mohave County benchmarks that reflect current economic challenges:

  • McKinney-Vento Act Data, which measures student poverty data, indicates that there are, at least, 334 homeless students in Mohave County. This data, likely, understates the issue of student homelessness as seven (7) school districts in the County are not reporting data.
  • The latest Point-In-Time homeless count indicated that Mohave County had 359 residents classified as homeless.1
  • Temporary Assistance to Needy Families (TANF) child support has shown significant decrease from 584 in 2013 to 222 in 2023.
  • The share of households receiving SNAP benefits has shown a decrease from 15% in 2010 to 13% in 2021.

1Note that McKinney-Vento data and Mohave Point-In-Time Count data come from different sources which is why there is inconsistency between the two counts of homelessness. 

Workforce Commuting Patterns

Mohave County is home to over 221,000 people and nearly 51,000 jobs. Historically, the economy was driven, primarily, by the mining industry, with more recent gains in the services and industrial sectors.

According to 2021 Census On-the-Map data, over four in five (81.3%) of the jobs in Mohave County are filled by local county residents. Approximately 6 in 10 workers commute less than 10 miles to their job. A slightly smaller share (38.5%) commute between 10 and 50 miles each way (Exhibit 9).

Exhibit 9: Work Commute Characteristics, Mohave County, 2021 

Exhibit 9: Work Commute Characteristics, Mohave County, 2021

Employment

According to the U.S. News and World Report, statewide rankings, Arizona had the 5th fastest growing economy as measured by gross domestic product (GDP) in 2022. Employment (as measured by at-place-of-work jobs covered by unemployment insurance) within Mohave County is growing across the industrial and services categories, while employment has dropped slightly in government and significantly in the retail category.

Overall, there were 4,850 public and private “business” establishments with 58,854 workers in La Paz and Mohave counties in 2022. Private establishments added 5,325 jobs between 2020 and 2022. Most job growth has occurred in the trades, transportation, and utilities sectors, which added 4,525 jobs. Other private service producing businesses (such as health care and business services) gained 4,475 jobs. Manufacturing (goods producing) businesses added 725 jobs. During this time frame, the government sector (primarily education) added 1,100 jobs overall, while local and state government shed 25 jobs (Exhibit 10).

Exhibit 10: Change in Employment, La Paz & Mohave Counties, 2020 to 2022 


Exhibit 10: Change in Employment, La Paz & Mohave Counties, 2020 to 2022
Source: Arizona Commerce Authority.

Employment within the Lake Havasu-Kingman Metropolitan Statistical Area (MSA) continues to show improvement as total jobs increased to 55,600 in May 2023 — a gain of 500 jobs from the previous year (Exhibit 11).

Exhibit 11: Employment Trends: Jan. 2014 to May 2023 


Exhibit 11: Employment Trends: Jan. 2014 to May 2023
Source: Arizona Commerce Authority.

Please refer to Appendix A for additional demographic, socio-economic and housing data.  

Development Overview

Mohave County, along with its vibrant cities, towns, and communities, offers a high quality of life for residents, workers, and visitors. Located in northwestern Arizona, it is the fifth largest county in the U.S., and is bordered by the spectacular Grand Canyon on the east, Colorado River (north and west) and Lake Havasu/Parker Dam on the south. This area attracts many residents and tourists due to its relatively low cost of living and proximity to numerous attractions, including the Grand Canyon, Lake Havasu, and the Colorado River.

As part of this Housing Needs Assessment, the project team (consisting of staff from Mohave County and FCS GROUP) conducted interviews and obtained primary information from local developers, realtors, and business representatives as well as city and county officials, to ascertain the level of development activity that is occurring throughout Mohave and La Paz counties. Please refer to Section IV for a list of the stakeholders that participated in this study.

Current private and non-profit investment include major subdivisions and business/industrial developments. A summary of major developments that are moving ahead are summarized below.

New Residential Construction

Colorado City reports a wave of development activity, including conversions of large estates to multiple unit developments, as well as new detached and attached housing construction.

  • Bullhead City has an adequate water supply whereby the City can grow to approximately 120,000 residents. The City continues to support significant development potential through its General Plan, Strategic Plan and Smart Growth policies.
  • Bullhead City, currently, has approximately 1,000 multi-family units in planning, design, and construction phases. This development includes a recent groundbreaking for studio apartments near the Community College to be primarily utilized to house college students.
  • A “partnership” among the City of Kingman, Mohave County and a non-profit developer recently delivered a new affordable housing development for military veterans in Kingman. The 49-unit Veterans Villas is funded, in part, through the national Low Income Housing Tax Credit Program governed under Section 42 of the Internal Revenue Code, as well as the H.U.D. VASH voucher program.
  • Mohave County planners and community development staff are tracking several subdivisions currently under construction. These include:
    • Cerbat Vistas
    • Prairie Heights
    • Cedar Creek Estates
    • Centennial Park Unit II
    • Littlefield Heights
    • Viewpoint Estates
    • Valley Springs Estates
    • North Pointe
    • Valley View @ Sunrise Hills
    • Twin Palms Estates
    • Shipp Estates
    • Village Estates

Business and Industrial Activity

  • Advanced Manufacturing Training Center (AMTC). The Mohave County Community College (MCC) and CORE Construction, Inc. is in the process of building the AMTC, which will be a hub of workforce training that serves all of Mohave County. The AMTC is located at the Kingman Airport Industrial Park. The college is working with business and industry leaders in health care and advanced manufacturing to ensure courses at the future AMTC teach students skills that are in-demand in the regional workforce. NUCOR steel has agreed to work together with the goal of providing a skilled workforce eligible for employment. This is the first of many such partnerships that the college is developing with companies and industries throughout the region.
  • New Business Development Incubator. MCC and the Hualapai Tribe incubator will offer office space, technology, one-on-one coaching, and services that include business plan development assistance, marketing strategy, budgets, financing and much more. The Small Business Development Center at MCC will support daily services, and clients will be eligible for all SBDC funded services.
  • ISCO Industries Expansion. ISCO Industries recently chose the Kingman Industrial Park for expansion of its U.S. superregional distribution hub. The ISCO product line includes high-density polyethylene (HDPE) pipe and fittings, large-diameter pipe systems, fusion equipment, electrofusion, mechanical connections, culvert lining, piping accessories, HDPE manholes, structures, and pipe perforation.
  • Interstate Trailers Expansion. Interstate Trailers recently added 25,000 sq. ft. to its manufacturing facility at the Kingman Industrial Park. The Kingman Economic Development team helped facilitate the project expansion and site permitting/construction.
  • Future Business Projects. Mohave County planning and economic development staff are currently tracking 12 large business location/expansion projects that are expected to employ 4,000 to 5,000 workers over the next 4 to 10 years. These developments are primarily located in and around Kingman and in north Mohave County.

Transportation and Community Infrastructure Investments

In light of the recent level of development activity, Mohave County, local cities and the Arizona Department of Transportation (ADOT) are undertaking major new investments to improve connectivity and community livability. Examples include:

  • I-40/U.S. 93 West Kingman Traffic Interchange. The Arizona Department of Transportation is finalizing design work on a new interchange that will create a free flowing connection between Interstate 40 and U.S. 93, in west Kingman. The project will be constructed in two phases, with the Phoenix to Las Vegas directional ramps constructed first. Phase II will construct the directional ramps between Las Vegas and California, when traffic demands warrant the improvements and when available funding can be programmed. Phase 1 is currently in the design phase, with construction expected to begin in 2024 and finish in 2026.
  • I-40: Rancho Santa Fe Traffic Interchange. The Arizona Department of Transportation, in coordination with the City of Kingman and the Federal Highway Administration, is planning for construction of a new traffic interchange, the Rancho Santa Fe Traffic Interchange, on Interstate 40 (Exit 57), in east Kingman. The project accommodates future traffic volumes generated in the rapidly growing east Kingman area, and relieves congestion at the existing East Kingman interchange (Andy Devine Avenue/State Route 66, Exit 54).
  • Rancho Santa Fe Parkway Street Construction. The City of Kingman is constructing a two-lane street along Rancho Santa Fe Parkway, north of I-40, between Grand Canyon Road and Industrial Boulevard, near the Kingman Municipal Airport.
  • Kingman Downtown Revitalization. The City of Kingman is revitalizing the Downtown area by improving the walkability and aesthetics for residents, merchants, and visitors, while maintaining the historic character of Kingman. This will translate into a safe, attractive, comfortable, complete street that connects bicyclists, pedestrians, and vehicular users to several destinations along Beale Street between First Street and Sixth Street with connections to Historic Route 66.

As part of the Mohave County Housing Needs Assessment, an estimate of the residential buildable land inventory (BLI) within Mohave and La Paz County was generated to determine the amount of land available for future housing. The BLI uses the most current Geographic Information Systems (GIS) data provided and available for the two Counties. The analysis includes consideration of factors that are used to award favorable scoring for the location of future affordable housing developments that are eligible for funding through the federal Low Income Housing Tax Credits (LIHTC) program.

The study area for the BLI includes private properties in unincorporated areas of Mohave and La Paz counties within 2 miles of census defined places. This general area was adjusted to include populated places that are outside of the initial 2-mile buffer. The BLI analysis primarily focused on land that is within 2 miles from incorporated cities (Lake Havasu, Bullhead, Kingman, Colorado City, and Parker) and excluded land owned by governments and Native American tribes.

In addition, a supplemental analysis was conducted for the incorporated cities (Lake Havasu, Bullhead, Kingman, and Colorado City) to help identify potential LIHTC sites.

Methodology 

The objective of the BLI is to determine the amount of developable land available for future residential housing. The steps taken to perform this analysis are as follows:

1. Calculate gross acres by plan designation, including classifications for fully vacant and part- vacant parcels. This step entails “clipping” tax lots that are bisected by the study area to eliminate land outside the study area from consideration for development, at this time. Input by County staff was provided to assure the analysis is consistent with local development.

2. Calculate gross buildable acres by plan designation, by subtracting land that is constrained from future development, such as existing public right-of-way, common areas, private roads, cemeteries, parks and open space, washes, streams, floodways, and tribal land. Development on land within the 100-year floodplain is restricted by 50%. The Counties do allow for development on steep slopes. Area for slopes above 10% and 25% are called out but no additional reduction from the buildable land is taken.

3. Calculate net buildable acres by plan designation, by subtracting future public facilities such as roads, schools and parks from gross buildable acres.

The detailed steps used to create the land inventory are described below.

Residential Land Base

The residential land base reflects current Mohave County General Plan land use designations. No such land use plan is, currently, available for La Paz County. Properties that are within the residential land base include the following base zone classifications:

  • Rural Development
  • Rural Residential
  • Low Density Residential
  • Suburban Estate(s)
  • Suburban Residential
  • Suburban Development Area
  • Urban Development Area
  • Medium Density Resid/PUD
  • Medium Density Residential
  • High Density Residential
  • Neighborhood Commercial
  • General Commercial

These classifications have been kept consistent throughout the analysis.

Buildable Residential Land Categories The next step in the BLI analysis includes classifying each tax lot (parcel) into one of the categories listed below. In some cases, tax lots had to be split to accommodate different plan classifications. Split tax lots are treated as individual and might go into any of the categories described below.

  • Vacant land: Both Counties provided information on land considered to be vacant. These lands were subjected to review using land use categories within the parcel files and satellite imagery, via Google Earth. If the land is in a committed use, such as a common area, an assessment has been made to determine if it is to be classified as vacant, part vacant or other.
  • Partially vacant land: Properties that are occupied by a use (e.g., a home or building), but have enough land to be subdivided without the need for rezoning, are considered part-vacant. These are single home lots of at least five (5) acres. This determination is made using tax assessor records and satellite imagery. It is assumed that two (2) acres are retained by each existing home, and the remainder is included in the part vacant land inventory.
  • Developed: Properties unlikely to yield additional residential development for one of two reasons: they possess existing structures at densities that are unlikely to redevelop over the planning period; or they include parcels with Comprehensive Land Use Plan designations that do not permit housing development.
  • Other (Undevelopable): Properties which are regarded as unlikely to be developed because they are restricted by existing uses such as: public parks; roads; public right-of-way (ROW); common areas held by Homeowners Associations; cemeteries; or owned by a public agency.
  • City: Any incorporated land within current municipalities (Lake Havasu, Bullhead, Kingman, Colorado, and Parker).
  • Outside (Excluded): Any land outside the study area.

These tax lot classifications were validated using satellite imagery, street view, and assessor records. Preliminary results were refined based on County staff input received during the project planning process.

Development Constraints

The BLI methodology for identifying and removing development constraints is consistent with guidance provided by Mohave County. The BLI is intended to identify land that is suitable, available, and necessary for residential uses. “Buildable Land” includes residential designated land within the study area, including vacant and part vacant land. Public-owned land is, generally, not considered to be available for new growth. It should be noted that “available,” in this context, does not mean that the land is presently on the market. It is assumed, in this analysis, that such land might come on the market at some future point in time. Land is considered to be “suitable for new development” unless it is:

  • Severely constrained by natural hazards.
  • Subject to natural resource protection.
  • Within a floodway.
  • Within the 100-year flood plain.
  • Has steep slopes (over 25% slope).
  • Over two (2) miles away from public roads.

Based on County guidance, data provided by the Counties, and national sources2, the following constraints have been deducted from the residential lands inventory:

  • Open water.
  • Washes buffered by 50 feet.
  • Streams buffered by 10 feet.
  • Land within floodways.
  • Public lands (local or state parks, state wildlife areas, National Park Service, U.S. Fish & Wildlife Service, U.S. Forest Service, U.S. military, Bureau of Reclamation, Indian Lands).
  • Parks and open space.
  • Right of way including the aqueduct for the Central Arizona Project.
  • Areas within the 100-year floodplains are assumed to be partially developable (50% counted in vacant land supply).

2 National data sources are used mostly for La Paz County. These include FEMA flood and stream data. USGS elevation data to determine slopes. 

Slopes were deemed to be no hindrance for development within the Counties. For informational purposes only, the analysis does include a calculation of the acreage for land for slopes above 15%, as this might influence the construction of larger multi-family sites as well as slopes 25% and above. Exhibit 12 depicts the BLI study area.

Exhibit 12:  Buildable Land Inventory Focus Areas 

Exhibit 12:  Buildable Land Inventory Focus Areas


Exhibit 13 depicts the BLI Development Constraints  

Exhibit 13: Mohave and La Paz County Development Constraints & Environmental Features 

Exhibit 13: Mohave and La Paz County Development Constraints & Environmental Features

Exhibit 14 summarizes the part-vacant and vacant lands that are buildable after accounting for environmental constraints within unincorporated Mohave County. Note: detailed land use plan designation boundaries are not, currently, available for La Paz County.

Exhibit 14: Vacant and Part Cavant Lands, Mohave and La Paz Counties

Mohave County (Unincorp. Study Area) Vacant and Part Vacant Lands (buildable acres)*
analysis as of May 11, 2023

General Land Use Designation Part Vacant Vacant Grand Total
Rural Development Area* 17,308 194,777 212,086
Suburban Development Area 4,947 41,447 46,394
Urban Development Area* 1,241 16,935 18,176
Suburban Residential 114 17,666 17,779
Suburban Estates 778 11,517 12,295
Low Density Residential* 285 11,188 11,473
Rural Residential 166 9,400 9,565
General Commercial* 254 6,519 6,773
Medium Density Resid/PUD 105 3,054 3,159
Medium Density Residential* 61 3,091 3,151
High Density Residential* 55 1,219 1,274
Neighborhood Commercial* 40 756 796
Suburban Estate   5 5
Grand Total 25,354 317,573 342,927
La Paz County 5,722 50,301 177,676

* portion of these lands in MVIDD and along Colorado River may be subject to water supply constraints.

Source: 3J Consulting and FCS GROUP, Inc.

In addition to the analysis of buildable lands within the unincorporated portions of Mohave County, a preliminary analysis of site suitability for future LIHTC development areas was also completed for the municipalities of Colorado City, Bullhead City, Kingman, and Lake Havasu City, as summarized in Appendix B. (above) *A portion of these lands in MVIDD, and along the Colorado River, may be subject to water supply constraints.

Existing Inventory

Local housing inventory and tenancy patterns shed light on housing conditions and demand preferences. In 2021, there were 116,893 housing units in Mohave County, of which 93,179 units were classified as occupied and 23,714 units were not occupied by permanent year-round households. It is estimated that many of these 23,714 housing units are used as seasonal second homes or investment properties.

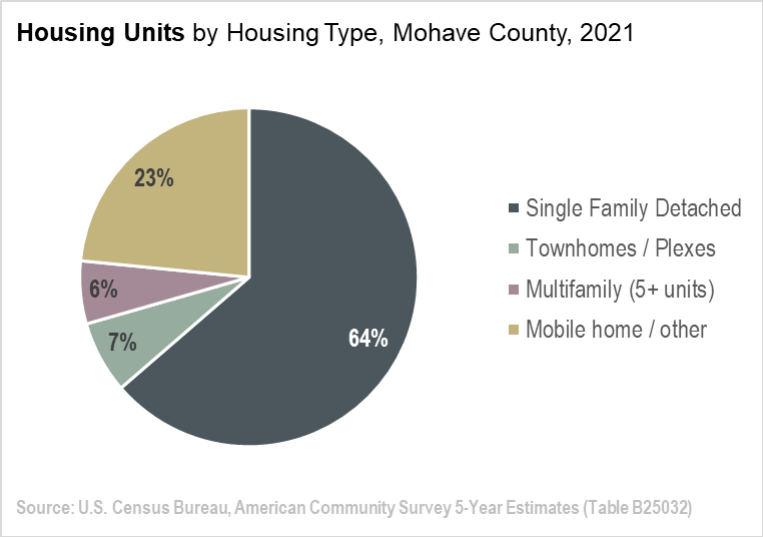
Like most counties in Arizona, single-family detached housing is the most prevalent housing type representing 64% of the housing stock. The remaining inventory in Mohave County includes mobile homes (23%), townhomes and plexes (7%), and multi-family (6%), as shown in Exhibit 15.

Exhibit 15: Existing Housing Mix

Exhibit 15: Existing Housing Mix

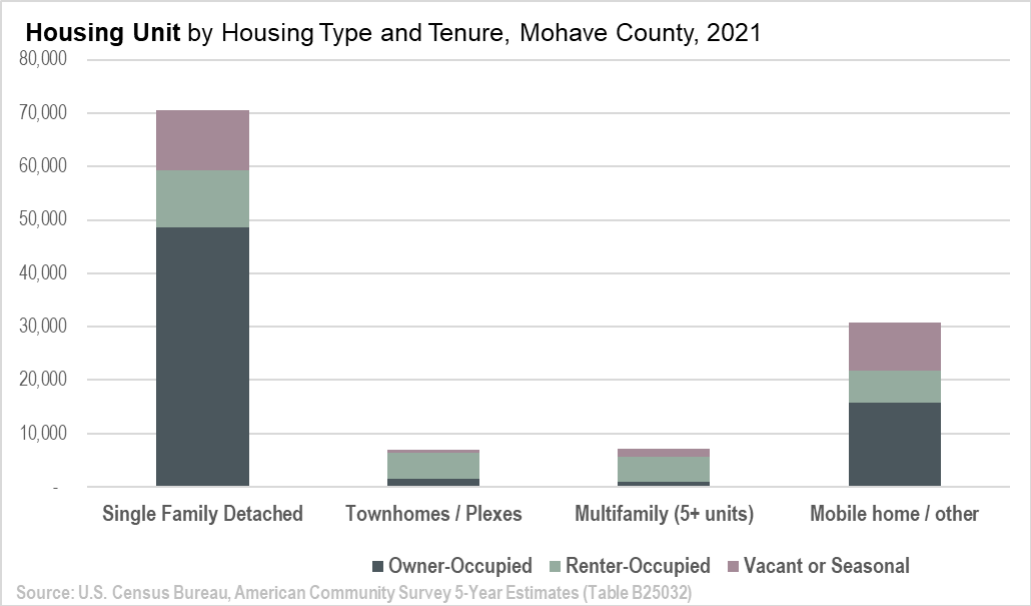
Owner-occupied housing units represent 58% of the housing inventory, while renter-occupied units account for 23% of the inventory, and vacant and seasonal units make up the remaining 19% (Exhibit 16).

Exhibit 16: Existing Housing Tenancy, 2021, Mohave County

Exhibit 16: Existing Housing Tenancy, 2021, Mohave County

The current overall housing vacancy rate in Mohave County is estimated at 1%. However, nearly one (1) in five (5) homes in Mohave County (19% of the entire housing inventory) are used as second homes, or seasonal housing, by out-of-county residents. The second home inventory represents 23,714 housing units in Mohave County.

While there is little data regarding short-term rentals in Mohave County, interviews with real estate professionals indicate that the short-term rental market (units rented on a daily, weekly, or monthly basis) is significant in waterfront communities, such as Lake Havasu City and Bullhead City, and is, also, increasing in Colorado City.

Officials from Lake Havasu City indicated that there are approximately 2,000 total short-term rentals units in the City, including 1,200 units that are registered and an estimated 800 rentals that are not registered, at this time. In Bullhead City there are 585 short-term rental units registered with the City, according to local officials.

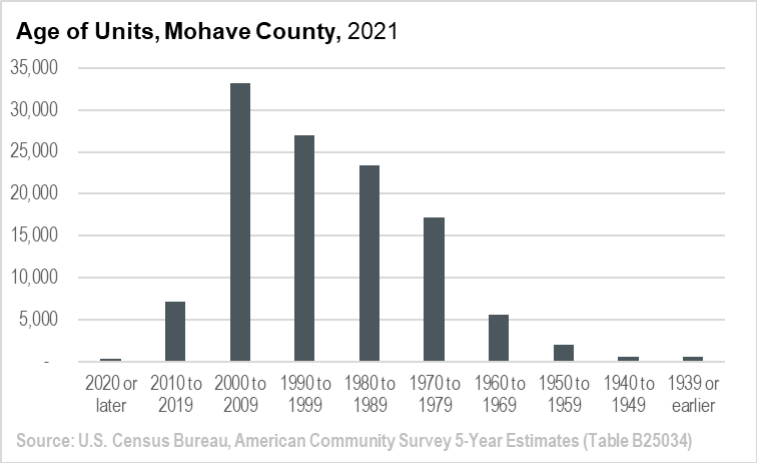
Exhibit 17 reflects housing units by year of construction. As of 2021, the median age of all housing units in Mohave County was 27 years (built in 1994). However, the median age for the rental housing inventory was slightly older at 30 years (built in 1991).

In comparison with statewide averages, the median age of owner-occupied housing in Mohave County was 26 years compared with 35 years for the state. The median age for rental housing in Mohave County is slightly newer than the State (26 years for Mohave County vs. 37 years for the State).

Exhibit 17: Dwelling Units by Year Built, Mohave County

Exhibit 17: Dwelling Units by Year Built, Mohave County

Subsidized and Income-Restricted Units

Assisted housing, with income restrictions, is one of the most important types of housing required to ensure that all housing needs are met. Without such units, it is difficult for many low-income households to avoid being cost-burdened. Among these units, it is, also, necessary to meet a range of household size requirements.

Within Mohave and La Paz counties, in 2022, there were 1,563 income-restricted subsidized housing units, among several locations (Exhibit 18).

Exhibit 18: Income Restricted Housing for Residents Earning Less Than 120% MFI, Mohave County

Income Restricted Housing by Location Dwelling Units
Bullhead City 699
Kingman 413
Lake Havasu City 378
Mohave Valley 44
Parker 29
Total 1,563

Source: NHPD & Policy Map

Income Restricted Housing by # of Bedrooms Count
1 809
2 445
3 309

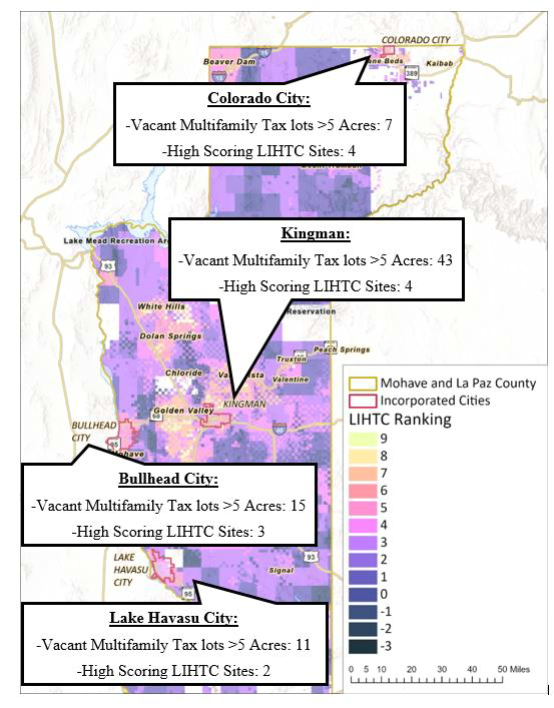
Income-restricted affordable housing in Mohave County has, traditionally, been constructed primarily through the use of Low Income Housing Tax Credits (LIHTC). There are currently 1,075 LIHTC units in Mohave County (Exhibit 19).

Exhibit 19: LIHTC Dwelling Units, Mohave County, 2023

Year Project Name City LI Units
1992 Copper Ridge Apartments Kingman 31
1993 Vista Loma Apartments Bullhead City 41
1994 Marble Canyon Manor Bullhead City 132
1994 Glenridge Apartments Bullhead City 52
2001 Somerset Village Kingman 72
2006 Katherine Heights Villas Bullhead City 56
2006 Katherine Heights Townhomes Bullhead City 54
2006 Tivoli Heights Village Kingman 48
2006 Aha Macav Housing I Mohave Valley 44
2006 Becket House Apartments Lake Havasu City 100
2007 Katherine Heights Townhomes II Bullhead City 54
2007 Tivoli Heights Village Phase II Kingman 48
2008 Katherine Heights Townhomes III Bullhead City 37
2008 Chaparral Apartments Kingman 20
2008 Cimarron Apartments Kingman 40
2011 Lakeview Villas fka Casa Del Lago Lake Havasu City 84
2015 Briarwood Apartments Lake Havasu 56
2015 Kingman Heights Apartments Kingman 57
2019 Kingman Veteran Villas Kingman 49
Total Units     1,075

Source: Arizona Department of Housing and Mohave County, May 2023.

Housing Values and Rents

Home values in Mohave County have increased significantly in recent years. As indicated in Exhibit 20, median home price indices in the cities of Mohave County have increased between 17%-21.3% over the last two years.

As of May 2023, there were 634 housing units actively listed for sale in Mohave County, of which only three (3) units were priced below $172,000. Hence only 0.5% of the listed homes would be considered attainable to households earning 80% of the area median income.

City 2020 2021 2022 Annual Change %
Bullhead City $231,171 $294,085 $317,540 17.2%
Kingman $191,805 $247,281 $271,093 18.9%
Lake Havasu City $335,465 $444,214 $493,819 21.3%
Parker $277,298 $344,207 $405,314 20.9%

Source: Zillow.com; analysis by FCS 5/19/23

Currently, the HUD fair market rents within Mohave County range from $711, for an efficiency unit, to $1,651, for a four-bedroom unit, as shown below.

Fair Market Rents, Mohave County, 2023

$711 $831 $1,058 $1,473 $1,651
Efficiency One-Bedroom Two-Bedroom Three-Bedroom Four-Bedroom

Housing Gap Analysis

An analysis of rental housing demand and supply indicates that there are existing market gaps yet to be addressed by housing builders or developers. The most significant market gaps are contained within the upper- and lower-end of the market. For example, with 8,189 existing rental households in Mohave County earning $50,000+ annual income, the number of available rental units at attainable price levels included only 3,488 units. Hence, there is estimated pent-up demand for, approximately, 4,701 quality market-rate rental units with rents upwards of $1,250 per month (one-bedroom units) and $1,875 or more (for two+ bedrooms).

In addition to the current housing gap for market rate apartments, there is, also, significant demand for additional lower-cost rental units priced at $500, or less, per month. As indicated in Exhibit 21, there are, approximately, 8,040 rental households in Mohave County with incomes below $20,000, but only 4,531 rental units priced under $500 per month. This creates a market gap of 3,509 low- income rental units with an allocation of: 60% studio/one bedroom; 30% two bedroom; and 10% three-bedroom units. As a result of the inadequate supply of rental housing, many low-income households are paying well over 50% of their income on inadequate rental housing.

These gaps in the existing rental inventory result in a shortage of housing in the upper and lower rental unit categories. As a result, mid-level rental housing stock is a heavily competitive portion of the rental housing market that is addressing demand from lower- and middle- and upper income households to achieve market equilibrium.

As such, there is a current “pent up demand” for rental units needed at the upper- and lower-income affordability levels. As shown in Exhibit 20, it is estimated that the current near-term market demand for rental units includes 4,700+ market rate units (rents at $1,250 or above) and 3,500+ affordable units (rents at $500 or below).

Exhibit 21: Current Rental Housing Market Gap, Mohave County

Median Household Income Range Affordable Monthly Rent Cost* Renter-Occupied Households Existing Rental Inventory Housing (Gap) or Surplus Pent Up Demand
$75,000 or more
$50,000 to $74,999
$1,875
$1,250-$1,875
3,742
4,447
1,037
2,451
(2,705)
(1,996)
(4,701) market rate gap
$35,000 to $49,999
$20,000 to $34,999
$875-$1,250
$500-$875
4,638
5,530
8,650
9,728
4,012
4,198

Less than $20,000
Zero or Negative Income
Less than $500
Requires subsidy
4,947
3,093
1,770
2,761
(3,177)
(332)
(3,509) subsidized housing gap
Total   26,397 26,397
(8,210)

Source: U.S. Census Bureau, American Community Survey S25103 & B25063; FCS Group.

*Calculated as 30% of income range based on HUD guidelines

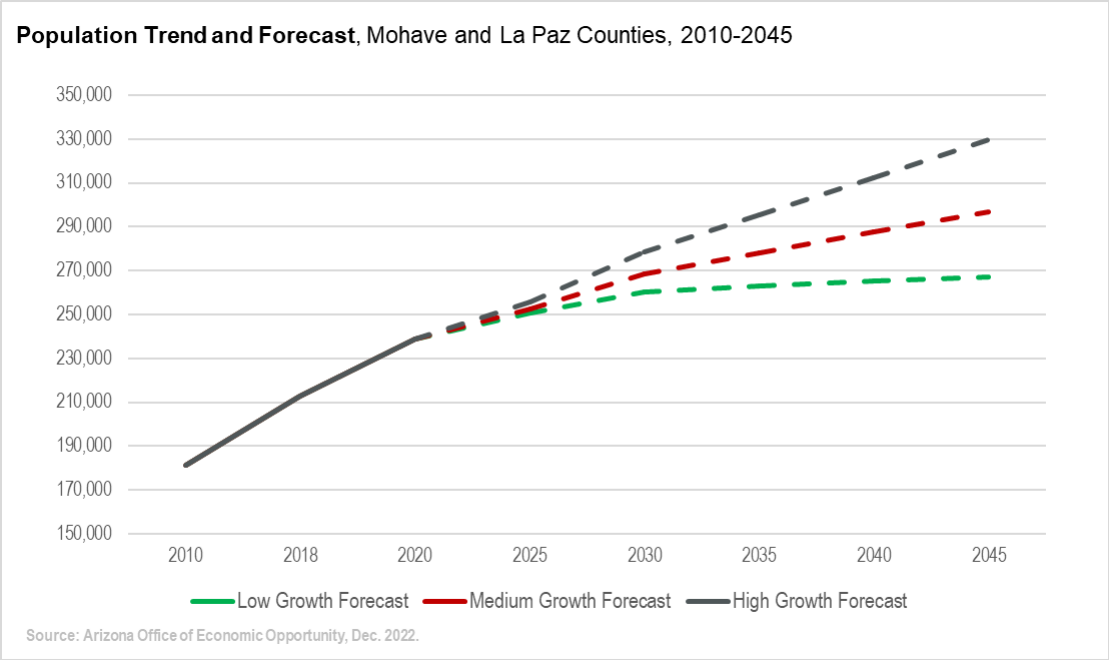
Population Growth Forecast

Arizona continues to be among the fastest growing states in the U.S. According to the Arizona Commerce Authority, Office of Economic Opportunity, the statewide population is projected to increase from 7,409,200 to between 8,855,300 and 10,393,300 people by year 2045. The low, medium, and high population growth forecasts, provided by the Arizona Office of Economic Opportunity, indicate that Mohave and La Paz Counties, in aggregate, can expect to add between 29,335 and 91,535 residents between 2022 and 2045. This equates to an annual average growth rate (AGR) of between 0.5% and 1.4%.

Stakeholder Advisory Committee input indicated that the County will, likely, grow faster than the low and medium forecasts, but not as fast as the high forecast. In light of the direction from the Advisory Committee, a medium-high forecast has been assumed for projecting housing needs, into the future, which is based on the mid-point of the State’s medium and high growth rates (equates to 1.19% annual average rate of growth). It should be noted that a future population growth rate of 1.19% is well below the historical average rate of growth that has occurred in the local area over the past 22+ years.

The resulting medium-high growth forecast for Mohave and La Paz Counties (75,085 residents added by 2045) is utilized for this housing needs assessment (see Exhibit 22).

Exhibit 22: Mohave County Population Trend and Forecast (2010-2045)

Exhibit 22: Mohave County Population Trend and Forecast (2010-2045)

Housing Need Forecast

The baseline housing demand forecast considers net new housing needed to meet additional population growth and the mix of housing types that would, most likely, address future market requirements. The housing needs take into account the following factors:

  • Immediate need for 8,200+ rentals or subsidized housing units to accommodate current pent-up demand as discussed in Exhibit 21
  • Medium-high population growth forecast assumes 75,000+ net new residents added over the next 20 years throughout the study area
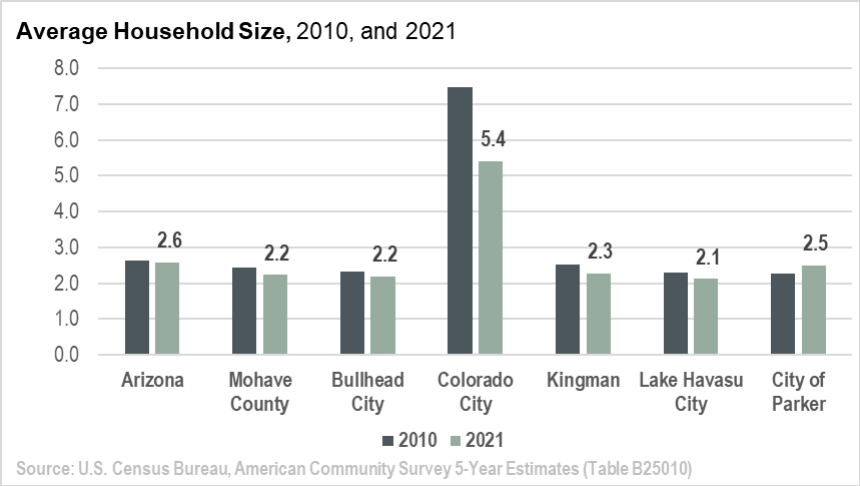
  • Average household size (2.24 people per occupied dwelling)
  • The share of all housing that is owned by part-time residents or investors is expected to increase from 19.3% (2022 est.) to 20% by year 2045
  • Potential for development of additional government-subsidized housing
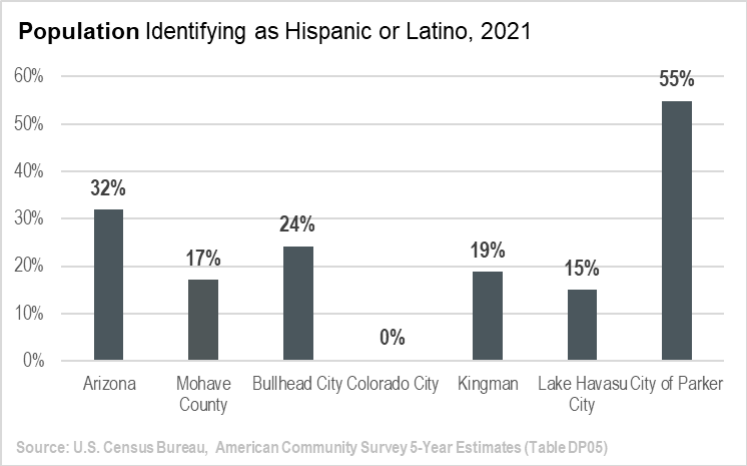
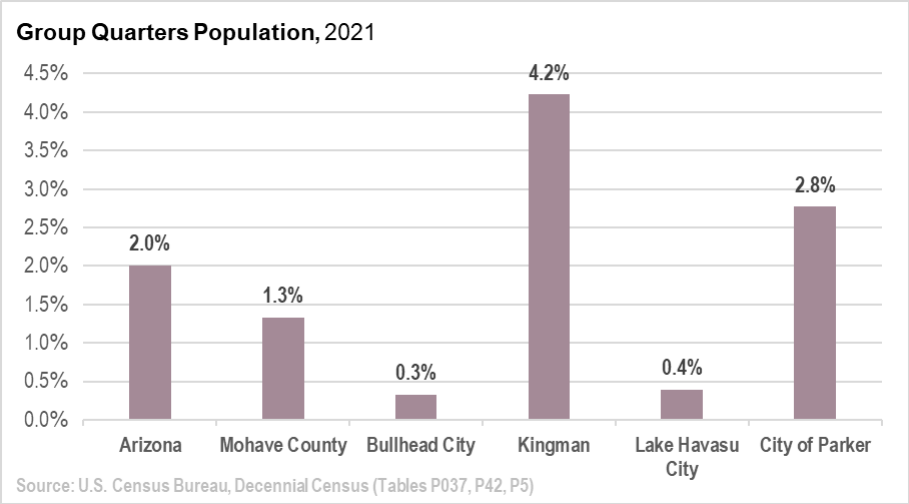
  • Consistent allocation of population that resides in group quarters arrangements (1.3%)
  • Adequate infrastructure (water, sewer and road capacity) is available to accommodate future development or single-family subdivisions within cities and in unincorporated communities

The baseline forecast reflects a range in housing types to address market preferences and demand for more attainably priced “middle housing” types, such as apartments, plexes, manufactured homes and accessory dwellings.

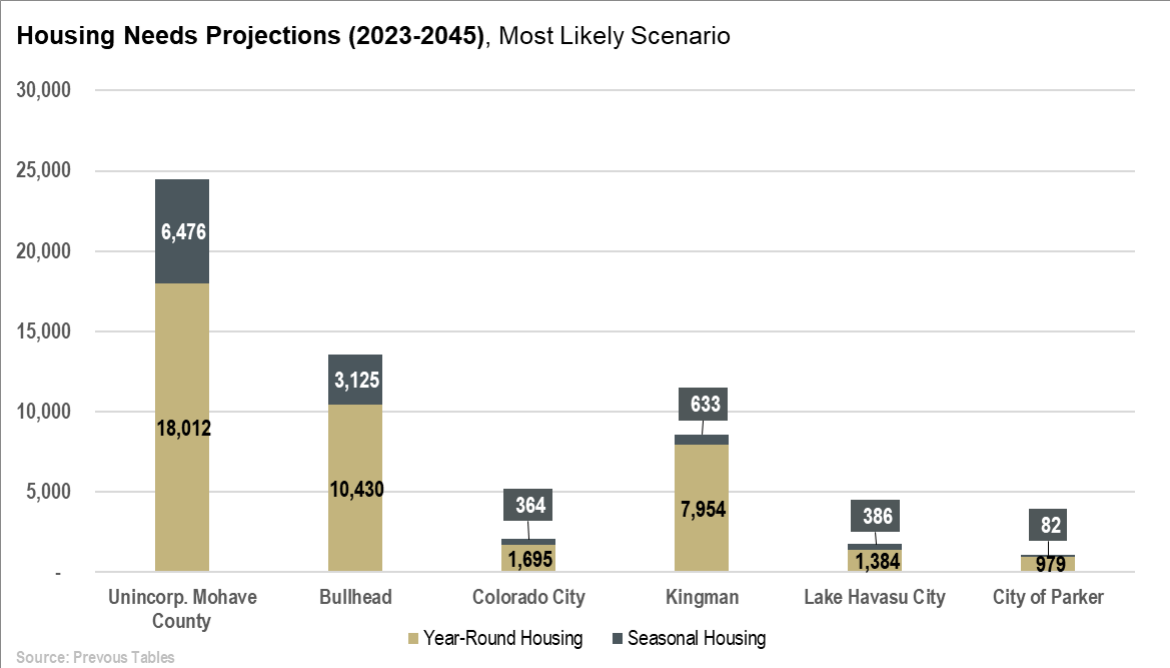
As indicated in Exhibit 23, the baseline population growth forecast requires, approximately, 50,675 net new housing units within the study area over the next 20-25 years. This includes:

  • 33,065 housing units for permanent year-round residents based on population growth
  • 9,400 seasonal housing units for part-time residents
  • 8,210 apartment units to address short-term market supply gaps
  • Shared housing for 1,018 people living in group quarters arrangements, such as assisted living, congregate care, transitional housing, and emergency housing.

Exhibit 23: Net New Housing Needs by Type: 2022-2045

Mohave County Housing Needs: 2022 to 2045
Likely Growth Scenario* 2022 Est. 2045 Proj. Proj. Change
Mohave County Population 237,965 313,050 75,085
Less Group Quarters (1.6%) 3,228 4,246 1,018
Pop in Households 234,737 308,804 74,067
Avg. Household Size 2.24 2.24  
Households (year round) 104,793 137,859 33,065
Vacancy and Seasonal Housing (%) 19.3% 20.0%  
Vacancy and Seasonal Housing (units) 25,065 34,465 9,400
Baseline Housing Demand 129,858 172,324 42,465
Pent-Up Rental Demand - - 8,210
Total Housing Demand (dwelling units) - - 50,675
Plus Group Quarters Pop.     1,018
Proj. Group Quarters Housing (rooms)**     679

** based on midpoint of middle and high growth forecast from AZ Office of Economic Opportunity.
** assumes 1.5 people per room.

Projected Housing Demand by Housing Type and Location

Exhibit 24 identifies the types of housing products that are most consistent with the projected housing needs for Mohave County by household income levels. The potential allocation of housing demand takes into account current trends, data, and infrastructure capacity, as well as buildable land opportunities, as identified herein.

Exhibit 24: Projected Net New Housing Needs by Type and Location: 2022-2045

  Unincorp. Study Area Bullhead Colorado City Kingman Lake Havasu City City of Parker & Parker Strip Total
Single Family Detached 13,176 7,320 1,464 5,856 878 586 29,280
Townhomes / Plexes 658 1,645 247 1,028 411 123 4,112
Multifamily (5+ units) 287 1,638 205 1,228 655 82 4,095
Mobile home / other 9,232 3,033 132 528 - 264 13,188
Total Dwelling Units 23,352 13,636 2,047 8,640 1,945 1,055 50,675
Potential Demand by Location 46% 27% 4% 17% 4% 2% 100%
Seasonal Housing Demand 5,338 2,576 300 522 318 68 9,122
Permanent Housing Demand 18,015 11,060 1,747 8,118 1,627 987 41,554

* Likely Growth Scenario based on midpoint of medium and high growth population forecast. Table does not reflect group quarters units/rooms.

Public Engagement Plan and Groups Contacted

The Public Engagement Plan (provided in Appendix C) for the Mohave County Housing Needs Assessment is consistent with local and state requirements and reflects best practices. The community outreach process utilized virtual video conference meetings, in person presentations, and interactive surveys to evaluate housing affordability, availability and local policies. At the outset of the project, a draft Public Engagement Plan was developed and refined based upon input from county staff.

The engagement plan had four objectives:

  1. To provide a forum to share, develop and refine useful information and data;
  2. To ensure a shared understanding of current conditions, issues, concerns, and opportunities;
  3. To provide avenues for the public, applicable committees, and supporting agencies to be involved;
  4. To build support for eventual adoption and implementation.

Housing Advisory Committee (HAC) Meetings (3): HAC members represented a range of informed and committed stakeholder interests. It included representatives of local government agencies, direct service providers, local property owners, residents, and real estate professionals. The Committee provided input on key project issues and decisions, helped to shape housing policy options, guided stakeholder and community engagement strategies, and encouraged community members to participate in the planning process. The HAC met three times from January to June 2023.

Stakeholder Input

Local interviews and surveys were conducted among city and county planning officials, realtors, developers, and building contractors. Questions focused on housing development issues, infrastructure availability and concepts for addressing the needs of lower-income residents. Survey respondents were asked to identify the most effective housing policies in their jurisdiction (city and county), and were asked to identify housing policies that could foster additional development.

Nearly 20 stakeholders (developers, builders, contractors, public officials) provided input for this study. A summary of issues and policies included:

  • There is a need for additional market rate and income-restricted housing (mostly apartments or plexes). However, much concern was expressed over the inability for private developers to obtain adequate return on investment (given relatively low median incomes and achievable rents) to fully fund multifamily developments without some form of public subsidy.
  • Participants noted the importance of retaining and attracting business and industry that provide good paying jobs for local residents. The success of these businesses will, over time, lead to higher income levels in Mohave County, which would in turn support private construction of more diverse housing types.
  • There is a perception that few large vacant development sites remain within the cities of Kingman, Bullhead City and Lake Havasu City.
  • Within Cities, developers expressed the need for expedited development review and approval procedures, less development regulations, and support for policies that help reduce housing construction costs.
  • Interviewees, generally, supported land use actions regarding: use of cluster zoning (such as lot size averaging with reduced setbacks for new buildings), a shortened subdivision approval process, clear and objective accessory dwelling unit standards, and increased categorical exemptions for multifamily developments.
  • While there is concern over the long-term impact of federal decisions over vested Colorado River water rights for communities that obtain municipal water from the river, the current allocations cited by Mohave municipalities appear to be sufficient to accommodate long term population and employment growth.
  • The issue of water rights transfers from one water basin to another is a current concern. If this is allowed to continue, it will likely reduce agriculture uses as residential development potential in unincorporated areas.
  • There is interest in seeing each city develop to its full potential, with a mix of housing types in proximity to services and public facilities (such as sanitary sewer, water and roads) and services (such as schools, community services, and activities).
  • In addition to development within cities, it was noted that the County could, also, consider planning and investment in new rural service centers in strategic locations, such as within a few miles of employment centers. These rural service centers could include specific area plans for major housing developments (for 500+ homes) on public lease lands with newly formed County Service Districts that finance roadways, water supply wells and sanitary sewage package facilities. As the land lease holder, the County would be in a position to select a master developer, secure financing for infrastructure, and require a portion of the development to include “income restricted” attainable housing.

We sincerely thank the following individuals who participated in study interviews. 
Dustin Rynyan, APX West 
Brit Wolf, APX West 
Nancy Cambell, Developer, Civic Leader  
Jeanne Kentch, Mohave County Assessor 
Wayne Wissinger, Eagle Realty, Developer 
Tyler Angle, Angle Homes 
Ron Foggin, City of Kingman, City Mgr. 
Bennet Bratley, City of Kingman Economic Development Mgr. 
Shirley Draper, City of Colorado City 
Vance Barlow, Town of Colorado City, Town Mgr. 
Toby Cotter, City of Bullhead City, City Mgr. 
Jess Knudson, Lake Havasu City, City Mgr. 
Nick Ponder, High Ground (water rights legal advisor) 
Jamie Kelley, Mohave County Water Authority (legal advisor) 
Leah Armendariz, Mohave Homes, Inc. 

Survey Input

The second survey, an online public outreach survey, was also developed with input from county staff. The survey focused on the identification of community-defined housing issues, housing affordability perceptions, and barriers to renting or owning a home. Survey respondents were asked to identify actions that local officials could take to address housing issues in their community. While the survey is not a statistical representation of all regional residents, the issues and perceptions provided by the respondents were believed to be, generally, consistent with supporting data and stakeholder input.

The survey received more than 800 responses. Detailed survey results are summarized below. While the survey is not considered statistically valid, it does provide a reliable indication of community perceptions regarding housing issues.

What Type of Housing Does Your Community Need Most?
Respondents indicated that the chief housing need in Mohave County are apartments followed by single family detached housing, and middle housing types.

What Are The Top Three Barriers To Home Ownership In Your Community?

Respondents indicated that the top barriers to home ownership in Mohave County are high housing costs, a lack of living wage jobs, and a limited supply of housing.

What Are The Top Three Barriers To Renting In Your Community?

Respondents indicated that the top barriers to renting in Mohave County are a lack of affordable rental units, availability of living wage jobs, and low vacancy rates.

Where Would You Like To See New Housing Constructed?

The two most common responses to this question indicated that respondents would like to see housing built in Mohave County’s cities as well as rural centers.  

This was an open-ended question which allowed respondents to choose what to share. Common responses included the following:

  • More housing is needed for vulnerable populations, especially seniors.
  • New housing is being priced for newcomers, which is unaffordable for long-time residents.
  • Need for more mobile home parks, sanctioned RV areas.
  • The working class are being priced out.
  • Vacation rentals are seen as part of the problem.
  • Rental application fees are very high.
  • Road and utility infrastructure limitations.
  • The permitting process can delay new housing construction.

To meet the demands of growth, Mohave County should plan to accommodate at least 50,679 additional housing units between now and 2045.  

Actual housing demand will, likely, surpass this long-range forecast over the planning horizon given that housing units will need to be replaced during that timeline.  

Key Findings

Key findings of the HNA and EOA include:

  • The population of Mohave County is forecast to grow between 0.4% and 1.4%, per year, over the next two decades, adding between 23,800 and 86,600 new residents.
  • Population growth will require the addition of between 11,745 and 50,784 dwelling units during the planning period as well as between 172 and 801 group quarters dwellings.
  • The current buildable land inventory is sufficient to accommodate future housing needs.
  • The county and cities may want to explore upzoning some residential lands to allow more middle and high-density residential development to accommodate rental housing needs.

Housing Policy Considerations

As part of the HNA process, FCS GROUP reviewed potential housing policies that cities and counties throughout Arizona have available to them to address various housing issues.

To accommodate the future needed housing mix projected in Mohave County, the county and cities may need to implement policies aimed at preserving and enhancing the existing housing inventory and incentivizing development of additional higher-density dwellings (cottage homes, duplexes and apartments).

As a part of this Housing Needs Assessment process, the consultant team is providing County staff with a list of policy options intended to increase production of needed housing.

The policy strategies can be separated into seven categories:

  • Zoning and Code Changes
  • Reduction of Regulatory Impediments
  • Financial Incentives
  • Financial Resources
  • Tax Exemption and Abatement
  • Land Acquisition, Lease, and Partnerships
  • Custom Options

As a part of the HNA planning process, the consultant team has compiled the following list of best practice housing strategies used in Arizona. The following table provides a summary of actions cities and counties have considered to foster development of a wide variety of housing types, particularly middle housing. Note that strategies in this list are ordered by category, not by priority.

Action Number Description Category
A-1: Develop Criteria & Process for Identifying Land to Upzone Develop criteria and a process for identifying land to up-zone (or rezone) to meet the deficit of land for multifamily development. The criteria may include considerations of location, transportation access, access to and capacity of infrastructure, site size, development constraints, and other relevant criteria. Category A: Zoning and Code Changes
A-2: Limits on Short Term Rentals (STRs) Identify and implement STR regulations allowable by the State of Arizona. Category A: Zoning and Code Changes
A-3: Remove Lot Coverage Standard Remove the lot coverage standard. Category A: Zoning and Code Changes
B-1: Reduce Minimum Setbacks and Lot Coverage in Residential Zones Amend lot characteristic standards, such as 15’ front and 5’ side and rear setback requirements, maximum lot coverage of 40%, to remove barriers to the development of a wider range of housing. Category B: Reduce Regulatory Impediments
B-2: Lower Off-street Parking Requirements for multifamily development Evaluate reductions to off-street parking requirements for multifamily housing, including housing serving seniors and other populations that may have lower car ownership. Category B: Reduce Regulatory Impediments
B-3: ADU Development Standards Simplify development standards for accessory dwelling units. Provide a set of pre-approved ADU building plans or pre-fab units that can be permitted by right. Category B: Reduce Regulatory Impediments
B-4: Transferable Development Density on a Parcel with Constraints Allow housing clusters on a parcel with constraints that prohibit or limit development, such as floodplains or slopes. This would allow the transfer of density to unconstrained portion of the parcel to be developed at a higher density than the underlying zone, leaving the constrained portion of the parcel undeveloped. Category B: Reduce Regulatory Impediments
C-1: Incentives to Encourage Developers Research incentives and funding opportunities which are available to private and non-profit developers and create FAQ sheets to inform developers on how to apply for those incentive programs. Category C: Financial Incentives
C-2: Incentives for Deed Restricted Housing Provide incentives to encourage developers to build a variety of housing types, including incentives to support income-restricted housing. Examples include reduction of fees for funding off-site infrastructure, bonus density allowances, and impact fee reductions. Category C: Financial Incentives


Action Number Description Category
C-3: Identify High-Priority Infrastructure Projects Identify areas of high priority for improving infrastructure to support new residential development, focusing on opportunities for new development. Category C: Financial Incentives
D-1: Ensure CIP Includes Funding for Infrastructure that serves future housing developments Ensure that local Capital Improvement Plans include funding for infrastructure necessary to support residential development. Category D: Financial Resources
D-2: Create an Affordable Housing Fund Create affordable housing fund, by identifying a funding source such as a retail sales tax, short term rental tax, transient room tax or other source. Category D: Financial Resources
F-1: Monitor Residential Land Supply & Housing Inventory Develop and implement a system to monitor the supply of residential land every two years. This includes monitoring residential development (through permits) as well as land consumption (e.g., development on vacant or re-developable lands). Category F: Land Acquisition, Lease, and Partnerships
F-2: Expand Role of Mohave County Housing Authority Continue to monitor supply of LIHTC developments and "naturally occurring" affordable housing (such as mobile home parks). Identify state and federal grant funding sources and serve as a conduit for expediting agreements to preserve existing and new deed-restricted affordable housing. Category F: Land Acquisition, Lease, and Partnerships
F-3: Land Banking & Site Assembly Public purchase of vacant/under-utilized sites or properties in foreclosure. As site assembly occurs over time new housing development opportunities can be created. Category F: Land Acquisition, Lease, and Partnerships
F-4: Public/Private Partnerships (P3) Partnerships between government and private developers and/or nonprofits have the potential to leverage financial resources with limited public investment in infrastructure or conveyance of land or development rights. Category F: Land Acquisition, Lease, and Partnerships
F-5: Housing on City/County Surplus Land Local agencies may designate surplus property for housing development that includes income restrictions. Category F: Land Acquisition, Lease, and Partnerships
Z-1: Education for Property Owners/Developers Provide information and FAQs to local developers and property owners to help them understand how to navigate the land use permitting process. Category Z: Custom Options

Category Arizona La Paz County Mohave County City of Bullhead Colorado City City of Kingman Lake Havasu City City of Parker
Population Statistics  
Total Population 7,079,203 16,845 211,274 41,064 2,744 32,204 56,510 3,324
Total Juvenile Population (up to 19) 1,809,340 2,919 39,557 8,186 1,528 6,994 9,254 931
% Juveniles (up to 19) 26% 17% 19% 20% 56% 22% 16% 28%
Median Age 38.1 57.1 52.3 51.5 17.8 41 54.8 36.1
Total Families 1,747,769 5,248 58,758 11,272 445 8,761 16,606 964
Average Family Size 3.16 2.32 2.72 2.70 5.76 2.76 2.56 2.74
Number of Households 2,683,557 8,678 93,179 18,586 507 13,532 26,486 1,295
Households with children under 18 716,125 1,553 16,449 3,667 307 3,371 4,056 534
% Homes with juveniles (under 18) 26.69% 17.90% 17.65% 19.73% 60.55% 24.91% 15.31% 41.24%
Avg Household Size 2.58 1.92 2.24 2.20 5.41 2.28 2.13 2.50
Education Statistics  
Population Enrolled in College 371,465 367 5,312 1,110 137 924 1,720 158
% Enrolled in College 5.25% 2.18% 2.51% 2.70% 4.99% 2.87% 3.04% 4.75%
Population Enrolled in Grad School 84,876 48 1,435 350 - 513 307 39
% Enrolled in Grad School 1.20% 0.28% 0.68% 0.85% 0.00% 1.59% 0.54% 1.17%
Population +25 4,792,007 13,182 162,829 31,066 1,049 23,406 44,852 2,118
Adults +25 less than a HS diploma 560,460 2,110 20,437 4,909 304 2,367 3,991 352
% Adults +25 less than a HS diploma 11.70% 16.01% 12.55% 15.80% 28.98% 10.11% 8.90% 16.62%
Household Access to Internet  
Households with broadband internet 2,350,265 6,130 77,696 15,617 372 11,937 22,676 1,095
% Households without broadband internet 12% 29% 17% 16% 27% 12% 14% 15%
Employment & Income Statistics                
Employed 56.80% 36.60% 42.30% 44.30% 47.10% 47.40% 43.50% 65.50%
Families with income less 5.60% 7.70% 7.00% 9.10% 37.10% 3.50% 6.30% 1.60%
Per capita income $34,644 $26,165 $29,657 $27,392 $9,887 $29,933 $36,569 $27,181
# of Households w/ SNAP 300,123 1,303 12,645 3,526 187 1,775 2,120 170
SNAP Participation rate 11.18% 15.01% 13.57% 18.97% 36.88% 13.12% 8.00% 13.13%
Uninsured population 743,344 2,402 19,589 3,481 1,189 2,016 4,851 575
% Uninsured 10.7% 14.4% 9.4% 8.5% 43.3% 6.5% 8.6% 17.8%
Families below Federal Poverty Level 9.50% 15.10% 10.90% 14.40% 50.10% 8.30% 8.00% 4.00%
Child Poverty rate 18.80% 27.40% 25.70% 30.20% 47.00% 16.50% 23.70% 7.70%

Source: U.S. Census Bureau, American Community Survey, 2021 5-Year estimates; compiled by FCS GROUP.

Housing Opportunity Index

Lake Haasu City - Kingman, AZ 2015 2016 2017 2018 2019 2020 2021 2022
Median Price $140,250 $145,250 $156,000 $168,000 $190,000 $214,250 $258,750 $274,250
Housing Opportunity Index 73.925 78.775 66.3 63.425 68.7 66.65 55.55 44.45
Median Income $44,700 $50,100 $46,000 $49,600 $56,200 $55,700 $55,700 $63,100
National Rank 123 89 145 139 137 200 155 130
National Metros Surveyed 225 229 232 238 238 244 236 239
National Percentile 55% 39% 63% 58% 58% 82% 66% 54%
Region West West West West West West West West
Regional Rank 14 9 15 13 13 30 12 9
Regional Metros Surveyed 67 71 71 72 72 79 71 67
Regional Percentile 21% 13% 21% 18% 18% 38% 17% 13%
Count of Observations in Metro 2,241 2,296 2,387 3,396 2,822 2,937 3,076 2,774

Source: National Association of Home Builders / Wells Fargo Housing Opportunity Index

Population, Income and LIHTC Units, Arizona Counties

Population Median HH Income Median Family Income Income Rank LIHTC Units
Arizona 7,151,502 $65,913 $78,845   37,390
Apache County 66,021 $34,788 $42,733 15 184
Cochise County 125,447 $55,077 $69,708 8 1,390
Coconino County 145,101 $61,888 $78,758 4 1,086
Gila County 53,272 $51,406 $59,089 10 566
Graham County 38,533 $57,105 $62,622 6 496
Greenlee County 9,563 $67,723 $69,443 2 -
La Paz County 16,557 $39,732 $49,872 14 130
Maricopa County 4,420,568 $72,944 $85,912 1 21,217
Mohave County 213,267 $49,738 $59,314 11 1,103
Navajo County 106,717 $46,126 $53,403 12 1,112
Pima County 1,043,433 $59,215 $75,199 3 5,672
Pinal County 425,264 $65,488 $74,126 5 1,118
Santa Cruz County 47,669 $45,089 $52,609 13 609
Yavapai County 236,209 $56,170 $70,299 7 1,498
Yuma County 203,881 $52,563 $58,589 9 1,209

Source: U.S. Census, American Community Survey, 2021; and Arizona Dept. of Housing.

The buildable land inventory was further analyzed with respect to selection criteria described in the Arizona Department of Housing, 2022 and 2023 Qualified Allocation Plan. A preliminary Low Income Housing Tax Credit (LIHTC) site opportunity analysis was conducted by utilizing Geographic Information Systems (GIS) data to screen for major housing development sites. The analysis utilized available land use data to evaluate LIHTC threshold eligibility factors, such as:

Areas to avoid

  • Industrial uses such as airports, hazardous waste sites, commercial junk yards, land fill, wastewater treatment facilities are prohibited.
  • Non-compatible uses such as adult entertainment and jail/prison.

Areas to seek out

  • Public Facility access
    • Areas with proximity to road network. Interstate highways are excluded from consideration. A site within a half-mile of a freeway might not be accessible.
    • Areas with proximity to utilities. Within half of a mile from community water system service areas for Mohave and La Paz County and Lake Havasu water and sewer mains.
  • Existing capacity of roads, sewer, and water must be analyzed on a “case by case” basis. It is currently not possible to perform this type of analysis, at the County scale, as there is no consistent GIS data for capacity available.

The LIHTC GIS data (shape files) that were used to identify areas of avoidance and preference were, mostly, provided by Mohave County. Widely available national data sources are included in the analysis if data was not available at the local level.

Mohave County provided location data for airports, hazardous waste sites, commercial junk yards, land fill, wastewater treatment facilities, adult entertainment, truck distribution facilities, industrial operations, detention centers, and Native American lands.

La Paz County was able to provide location information for junk yards, landfills, wastewater treatment facilities, and a detention center. La Paz County does not allow adult entertainment. Esri’s Living Atlas provides many authoritative data sets and was used to provide additional information for areas to avoid.

The map, below, depicts areas to avoid for addressing LIHTC developments.

depicts areas to avoid for addressing LIHTC developments

This analysis uses Arizona Department of Water Resources CWS service area boundaries for community water systems to fulfill the requirement to locate future LIHTC developments close to existing infrastructure. Additional utility data was provided by Lake Havasu City.  

Roadway access metrics focus on the local road networks and avoid interstates and U.S. highways.  The map below depicts areas with access to these critical infrastructure elements for LIHTC developments. 

infrastructure map

Using the screening criteria mentioned above, locations have been identified that have the highest relative potential for meeting State Tax Credit and LIHTC program requirements. The actual ranking includes additional factors regarding lot size, buildable acres and presence of slopes. This adds greater nuances to the development potential of individual sites. 

The ranking is based on the following categories:

Positive points are given to:

  • Lot size
    • Lots equal or greater than 1 acre – 1 point
    • Lots greater or equal to 5 acres – 2 points
  • Buildable land per lot
    • At least some buildable acreage - 1 point
    • At least 1 buildable acre – 2 points
    • At least 5 buildable acres – 3 points
  • Road network
    • Any site within a quarter mile – 2 point
    • Any site within a half mile – 1 points
  • Utilities
    • Any site within a quarter mile – 2 point
    • Any site within a half mile – 1 points

Negative points are given to:

  • Slopes
    • 75% of unconstrained land is covered by at least 15% slopes – -1 point
    • 50% of unconstrained land is covered by at least 25% slopes – -1 point
  • Exempt status
    • Any site with land owned by Local, County, State, Federal, Tribal – -1 point
  • LIHTC development barrier
    • Any site within half a mile of an area to be avoided – -1 point

A parcel can achieve a maximum of 9 points compared to the lowest value of -3. The ranking does evaluate sites on multiple factors. For instance, a parcel could achieve a very high rank value but is, also, within an area of avoidance. This analysis considers multiple aspects and is heavily weighted toward the availability of buildable land, as this is the most attractive aspect for a developer.

About 8% of parcels in Mohave County have a rank of 7 or higher. About 2,400 parcels rank 8 or higher making up 20% of the buildable land within the County. The majority of the sites are within a quarter mile of a water service area and almost all are within a quarter mile of a road. Only 7% of the 2,400 parcels are located close to an area to be avoided.

The map shown, below, shows eligible parcels in select cities based on their scoring/ranking of opportunity areas for LIHTC developments.

Analysis of Potential LIHTC Development Sites

development site map

These rankings can change over time. Factors such as availability of buildable land, changes to jurisdictional boundaries, public land that might open up to development, and new infrastructure are all subject to change, thus changing a sites’ ranking.

The project team inventoried and evaluated vacant tax lots with five or more acres of land area and local zoning that allows multifamily development to better understand their LIHTC development potential. The summary of the preliminary LIHTC analysis for each city is provided below.

Mohave County staff and local agencies and developers can utilize the LIHTC prospect database to identify future locations for both market rate and affordable housing developments.

Location Vacant Multifamily Tax Lots with over 5 acres Tax Lots that Meet Most LIHTC Scoring Criteria # of Identified Tax Lots with Highest Relative Score*
City of Kingman 43 24 4
Bullhead City 15 4 3
Lake Havasu City 11 2 2
Colorado City 7 4 4

* Tax lots identified as having the most positive and least negative LIHTC attributes.

Source: Mohave County Buildable Land Assessment, June 2023.

Project Overview

Mohave County is preparing a Housing Study and Needs Assessment to address current and future housing needs. The study will assess housing affordability for households, of all income levels, based upon county demographics, and include policy considerations aimed at enhancing the local housing inventory. 

Community Engagement Objectives

The public involvement process aims to meet the following objectives:

  • Clearly communicate project goals to community members and stakeholders.
  • Identify current regulatory challenges and their consequences based on the testimony of the people who are the most engaged with housing policy issues.
  • Obtain input and feedback on study recommendations from a broad cross-section of county residents, property owners/developers, city/county staff and public officials.   

Community Demographics

The following demographic profile will help specify the priority populations to engage in this process. Demographic data are derived primarily from the U.S. Census, American Community Survey 2021, and 2020 Decennial Census. Approximately 213,267 people lived in Mohave County in 2020. 

Race and Ethnicity

According to 2020 Decennial Census, approximately 80% of Mohave County residents identify as White. The largest ethnic group (16%) identify as Hispanic or Latino, and 9.5% percent identify with two or more races. The remainder of residents identify as Other Race (6.0%), American Indian/Alaska Native, (2.4%), Asian (1.3%), African American (1.0%), and Native Hawaiian/Other Pacific Islander (0.19%). 

Race/Ethnicity Mohave County Arizona
White 79.6% 60.4%
African American 1.0% 4.7%
Asian 1.3% 3.6%
Native Hawaiian and other Pacific Islander 0.2% 0.2%
American Indian or Alaskan Native 2.4% 4.5%
Two or more races 9.5% 13.9%
Hispanic or Latino (any race) 16.0% 30.7%

Languages Spoken at Home

Census data indicates that more Mohave County residents speak only English at home (89%), than in the state of Arizona as a whole (74%). The most spoken language other than English is Spanish (8.6%). 

Age

Mohave County has an aging population with a larger share of residents 55+ (46.7%) than the State of Arizona (30.5%), and a smaller share of residents 54 and under (53.2%) than the State of Arizona (69.5%). 

Age Mohave County Arizona
19 years and under 18.7% 24.7%
20 – 34 years 14.5% 20.5%
35 – 54 years 20.0% 24.3%
55 – 64 years 16.2% 12.1%
65 – 74 years 17.4% 10.8%
75 years + 13.1% 7.6%

Income

In 2021, the median household income in Mohave County was $46,616, which is lower than the state median ($69,056). About 52% of Mohave County households earn less than $50,000 annually.

Income Mohave County Arizona
<$15,000 14.3% 8.8%
$15,000-$25,000 13.5% 7.1%
$25,000-$50,000 24.9% 20.2%
$50,000-$75,000 17.6% 17.8%
$75,000-$100,000 11.7% 13.6%
$100,000+ 18.1% 32.4%

People with Disabilities

Census data indicates that 23.1% of Mohave residents live with a disability. This is higher than the Arizona state average of 13.6%. 

Housing

Census data indicates that, approximately, 63% of Mohave County residents live in a single-family home (detached single dwelling), which is slightly less than the State of Arizona (66%). Just over 7% of Mohave County residents live in middle housing (1 to 4 attached units), and another 5.3% occupy multi-family homes (with 5 or more units per structure). Approximately 24% of residents live in a mobile home--over three times the State of Arizona average. Nearly 74% of Mohave County residents are homeowners and 26% are renters.

Housing Type Mohave County Arizona
Single-family home 63.2% 66.1%
Middle housing 7.2% 9.9%
Multi-family home 5.3% 15.7%
Mobile home 24.2% 8.3%
Homeowners 73.7% 67.6%
Renters 26.3% 32.4%

Stakeholders and Partners

The Mohave County HNA process was guided by a 13-member Housing Stakeholder Advisory Committee that met on three separate occasions during the study (each meeting at a different location within the County). In addition to these meetings, the project team conducted interviews and surveys with housing stakeholders to obtain a broad range of perspectives from:

  • Affordable housing advocates
  • Tri-cities Mayor’s Coordination Council
  • Mohave Community College
  • Local housing developers and realtors
  • Bankers / Housing Lenders
  • School district representatives
  • Utility providers (water, sewer, power)
  • City and County planning and community development staff
  • County Assessor
  • City representatives