Arizona Department of Water Resources Presentation at the Northwest Basins Planning Area Stakeholders meeting Date: 5/18/2017
Northwest Basins Planning Area Water Demand Update
Northwest Basins Planning Area
Stakeholders Meeting
May 18, 2017
John Riggins Water Resource Specialist
Arizona Department of Water Resources
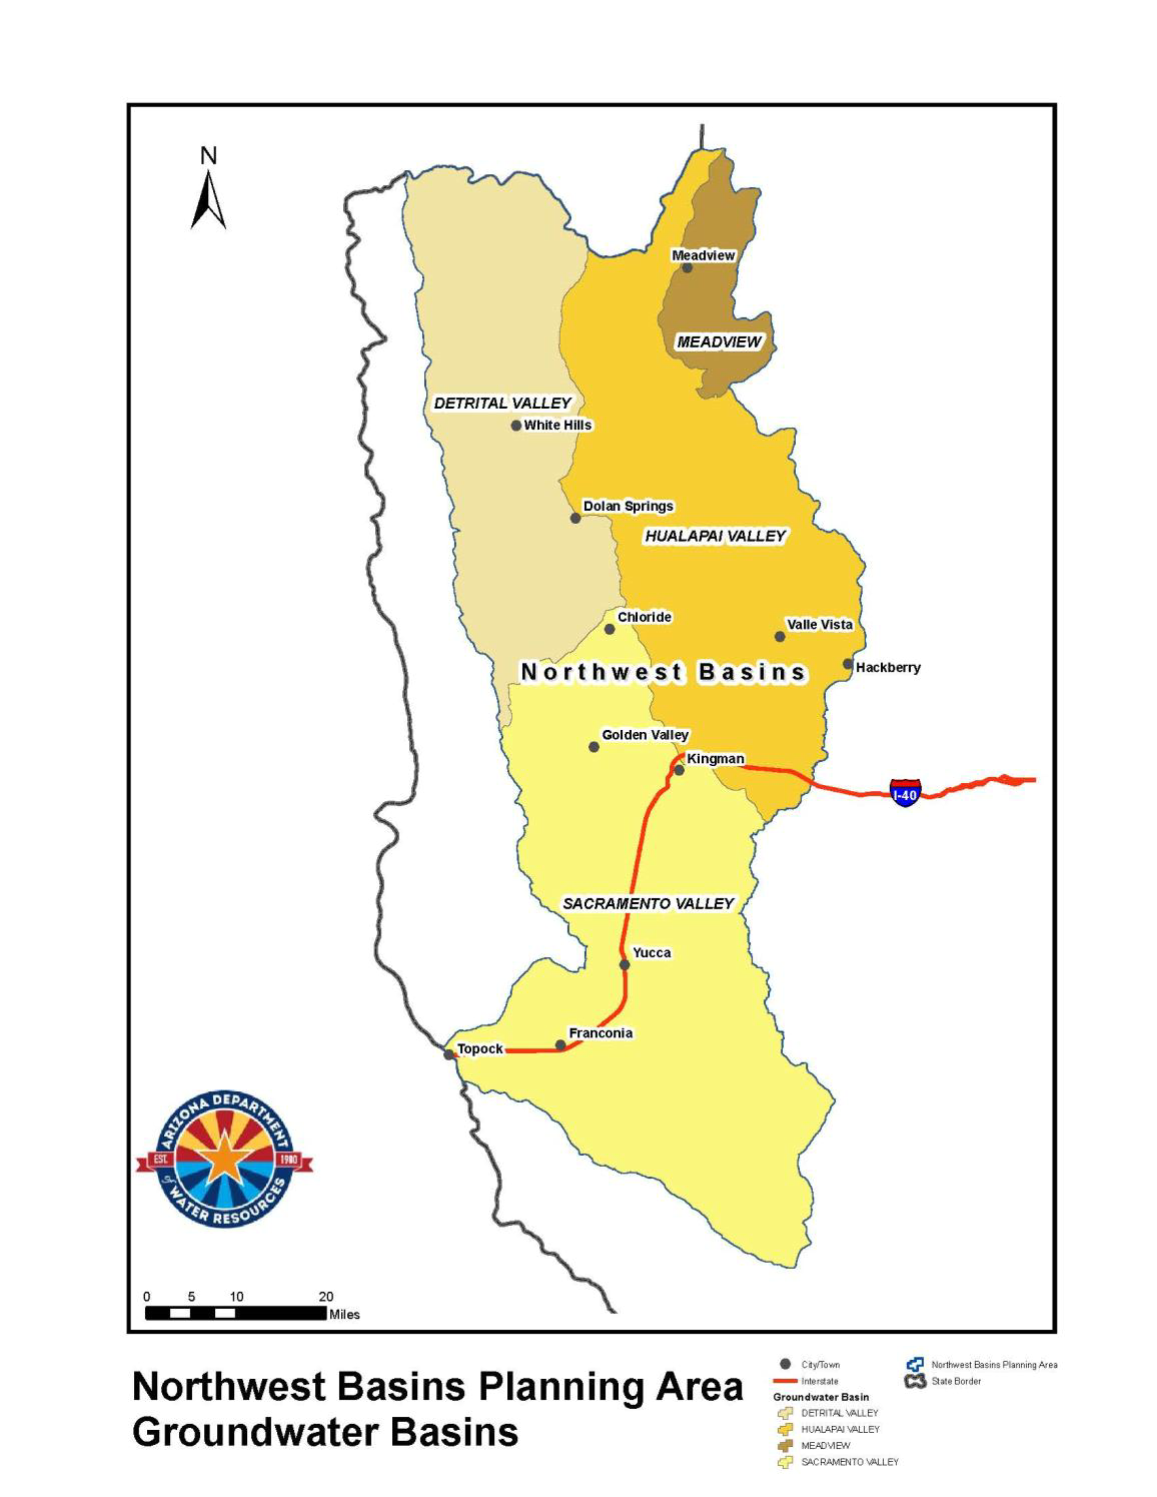
Northwest Basins Planning Area Groundwater Basins:
• Detrital Basin
• Hualapai Basin
• Meadview Basin
• Sacramento Basin
Updated Data: Municipal Demand
Updated Municipal Demands (acre-feet)
| 2010 | 2016 | 2035 | 2060 | |
| Arizona Water Initiative Planning Area Updated Projection |
10,895 | 11,189 | 14,030 | 18,850 |
| Strategic Vision Northwest Basins Municipal Projections |
12,782 | n/a | 22,638 | 28,260 |
All data in acre-feet (AF)/year
*Using CWS Data, holding 2014 GPCD constant throughout projection period
Northwest Basins Estimated Industrial Demand
| Updated Industrial Northwest Basins Planning Area |
2016 Updated Estimate |
| Mining | 57 |
| Rock Production | 3,050.6 |
| Power Production | 1,964.35 |
| Dairies/Feedlots | 2.5 |
| *Turf | 1,239.58 |
| Others: | |
| *Airpark | 91.1 |
| Proving Grounds | 103 |
| *Truck Stops | 55.7 |
| Manufacturing | 88.2 |
| *State Prison | 181 |
| Total | 6,833.35 acre-feet |
All data in acre-feet/year
*Data updated since February 28, 2017 meeting
Agricultural Water Demand Data Sources
U.S. Geological Survey (USGS) – 2016 field verification of groundwater basins per ADWR request
Conducted by U.S. Geological Survey Arizona Water Science Center
Hualapai & Sacramento Field Visit August 2016 USGS
Basins are monitored by USGS via Satellite
Next Field Verifications for Planning Area: 2017
Please note that these water demands are estimated water uses
based of scientific formula and not reported values. The 2016 water
demands in the following presentation are still considered
provisional and subject to change after further review
2016 is provisional estimated water withdrawal data
U.S. Geological Survey Data Collection
The USGS collects and estimates annual water withdrawals for ADWR for groundwater basins outside of Active Management Areas
- Areas where reporting is not required
Before 1991, the USGS used power use data to estimate irrigation groundwater withdrawals for these areas.
After 1991, the USGS established a method to calculate groundwater withdrawals for irrigation using these variables:
- Crop type
- Irrigation-requirement rates for a specific crop
- Irrigation type
Source: U.S. Geologic Survey, Water Use Program Overview Presentation; February 2, 2017
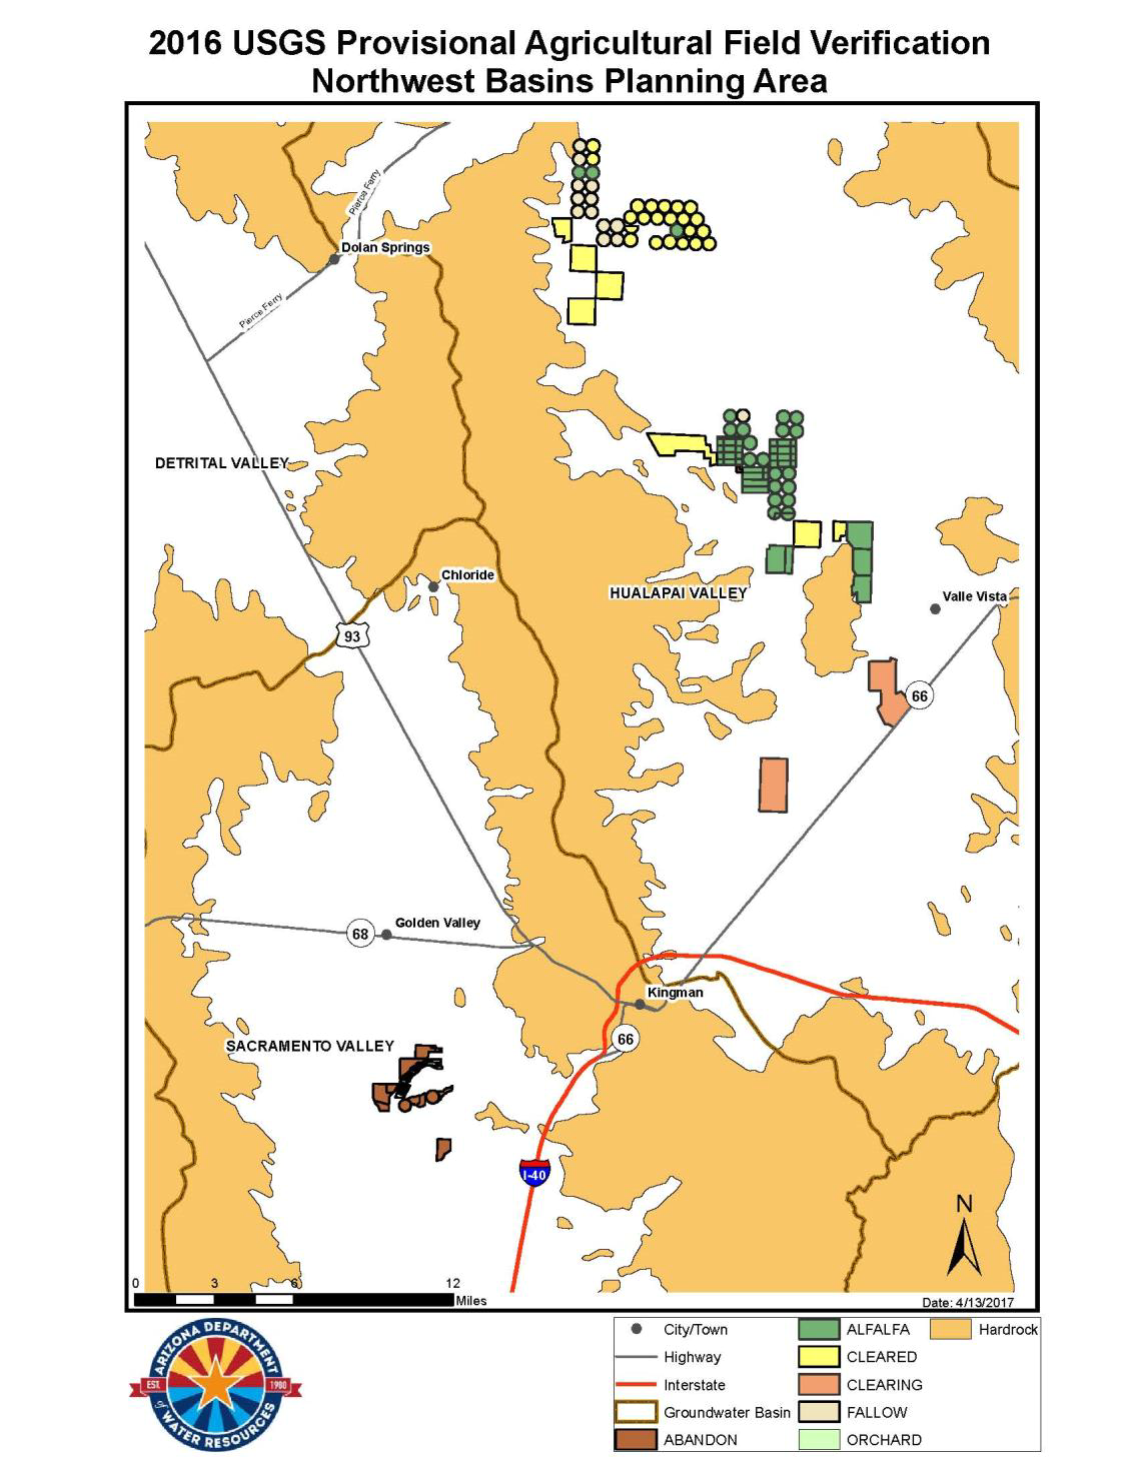
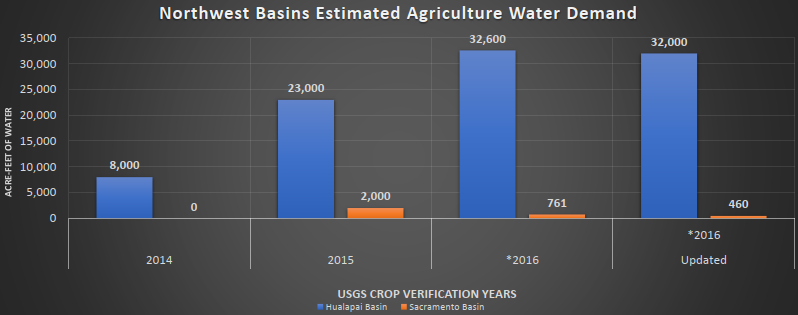
Previous Planning Area Estimated Agricultural Water Demand
| Basin | 2014 | 2015 | Initial Provisional Estimates 2016 | Updated *2016 |
| Hualapai Basin | 8,000 | 23,000 | 32,600 | 32,000 |
| Sacramento Basin | <300 | 2,000 | 761 | 460 |
| Total | >8,000 | 25,000 | 33,361 | 32,460 |
Source: U.S. Geologic Survey
2016 Estimated Water Withdrawal Data is considered provisional
All water demand values in acre-feet
Previous Planning Area Estimated Agricultural Water Demand
Source: U.S. Geologic Survey
*2016 Estimated Water Withdrawal Data is considered provisional
All water demand values in acre-feet
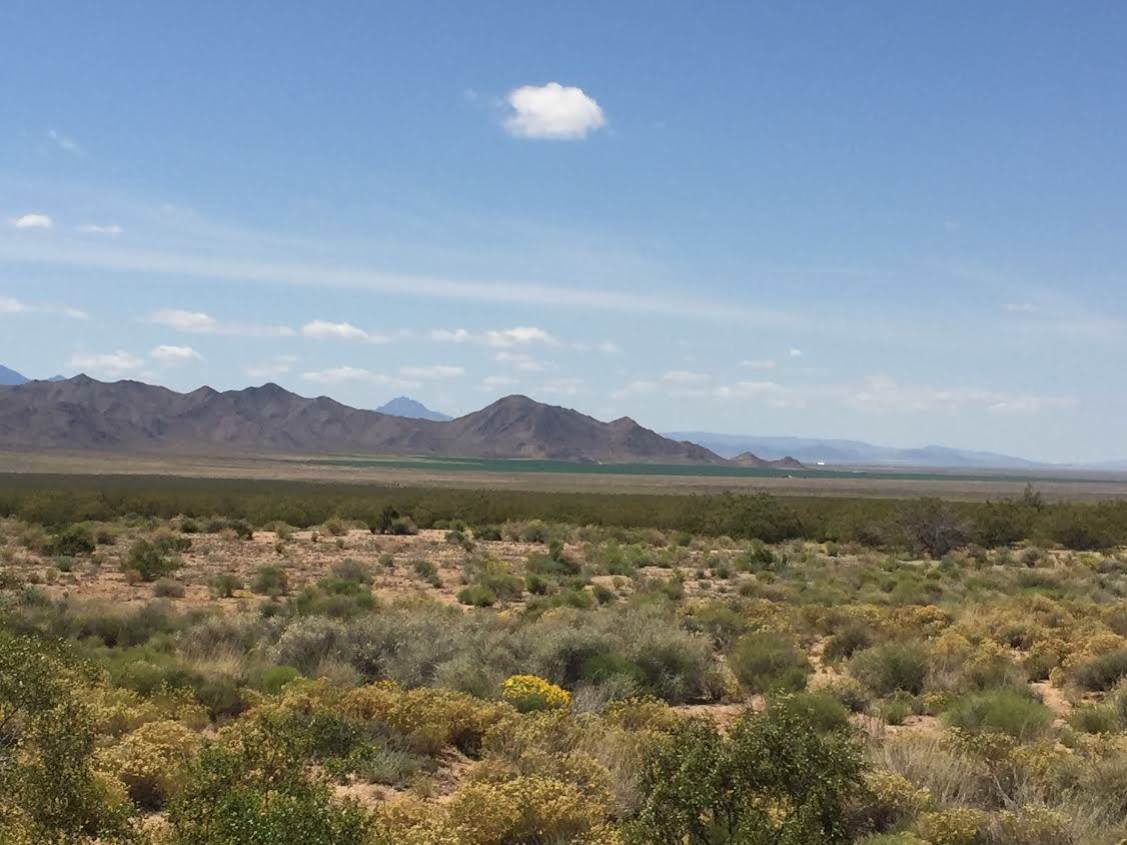
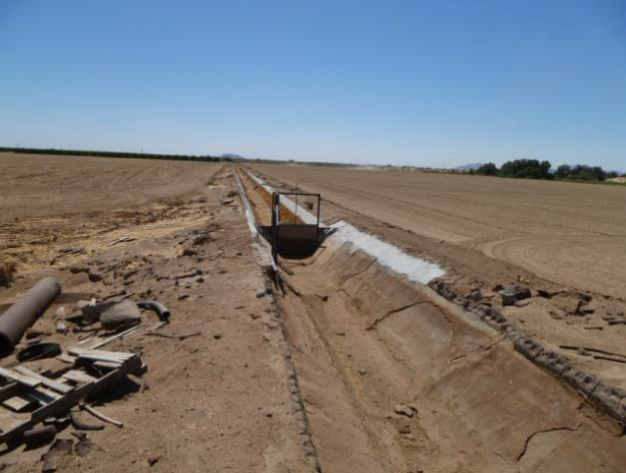
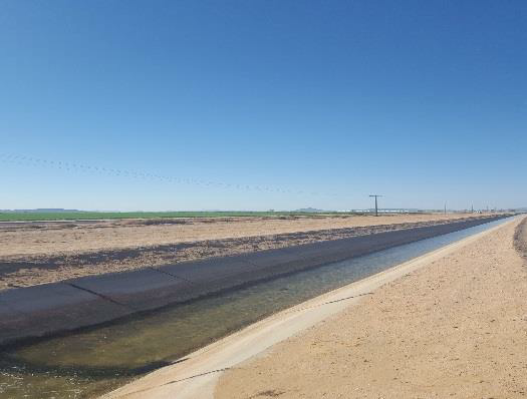
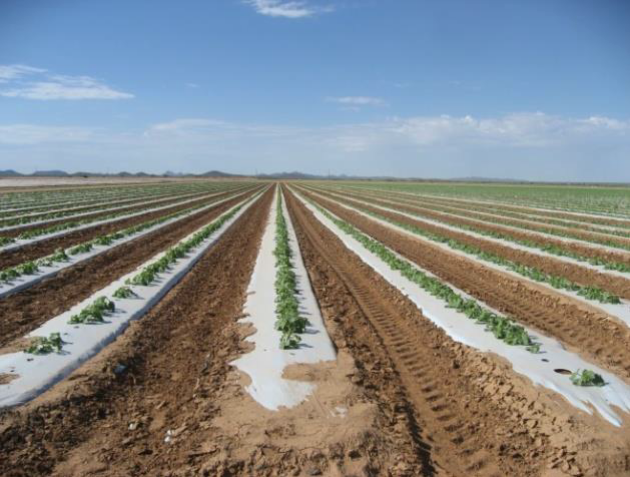
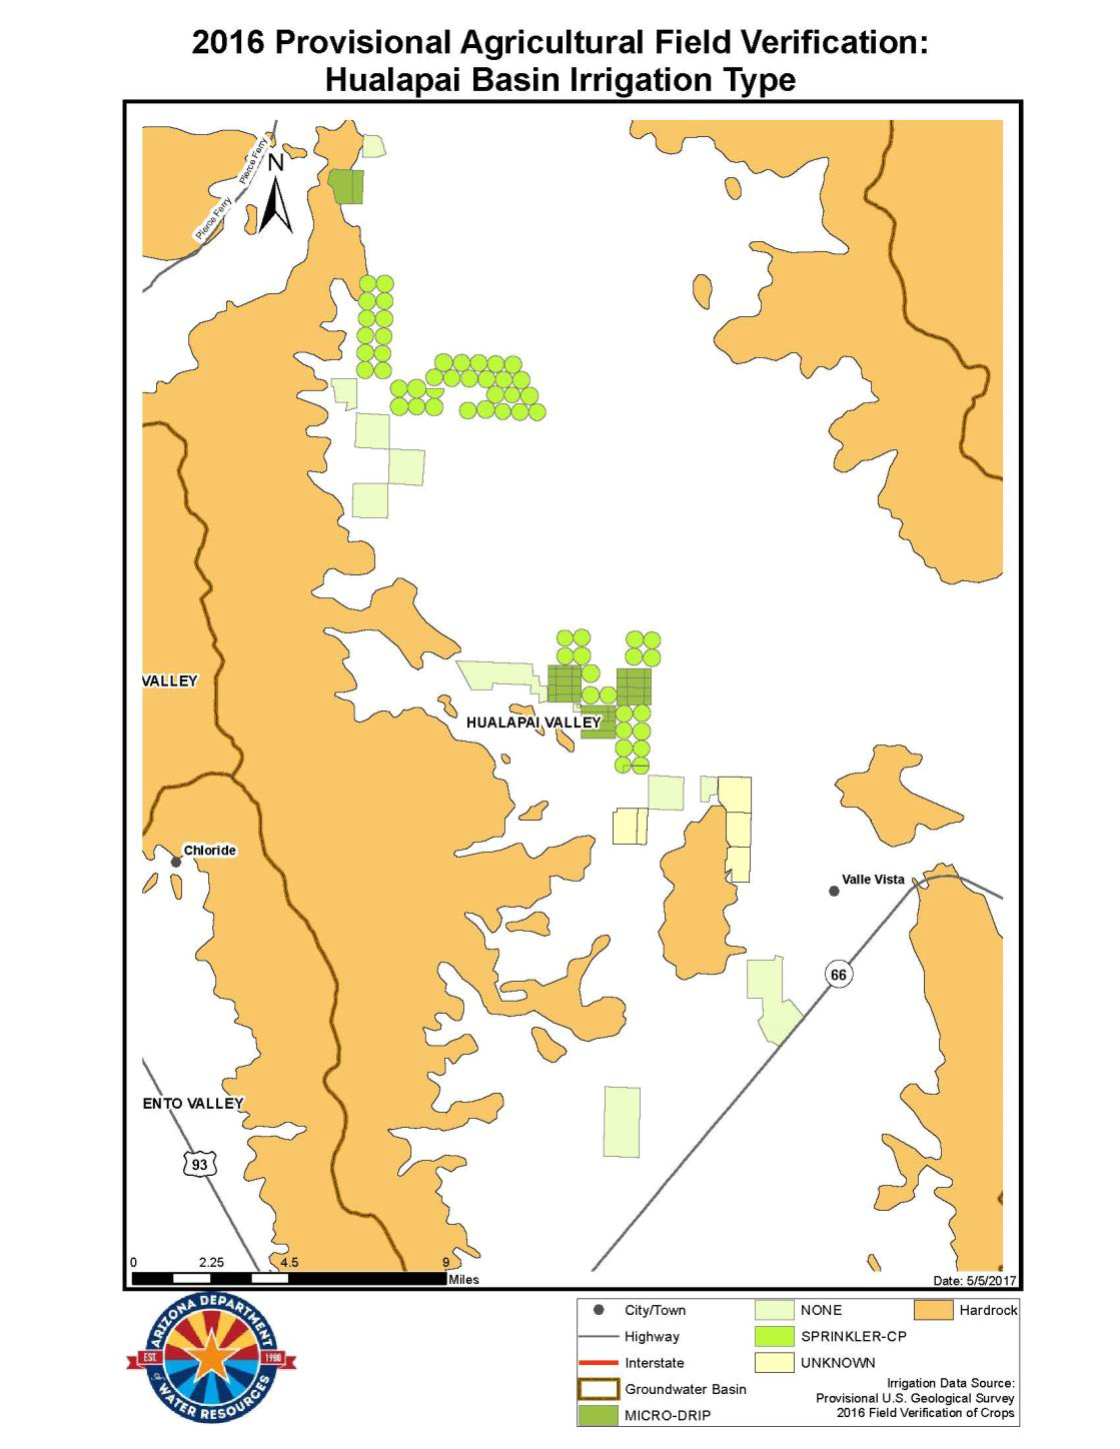
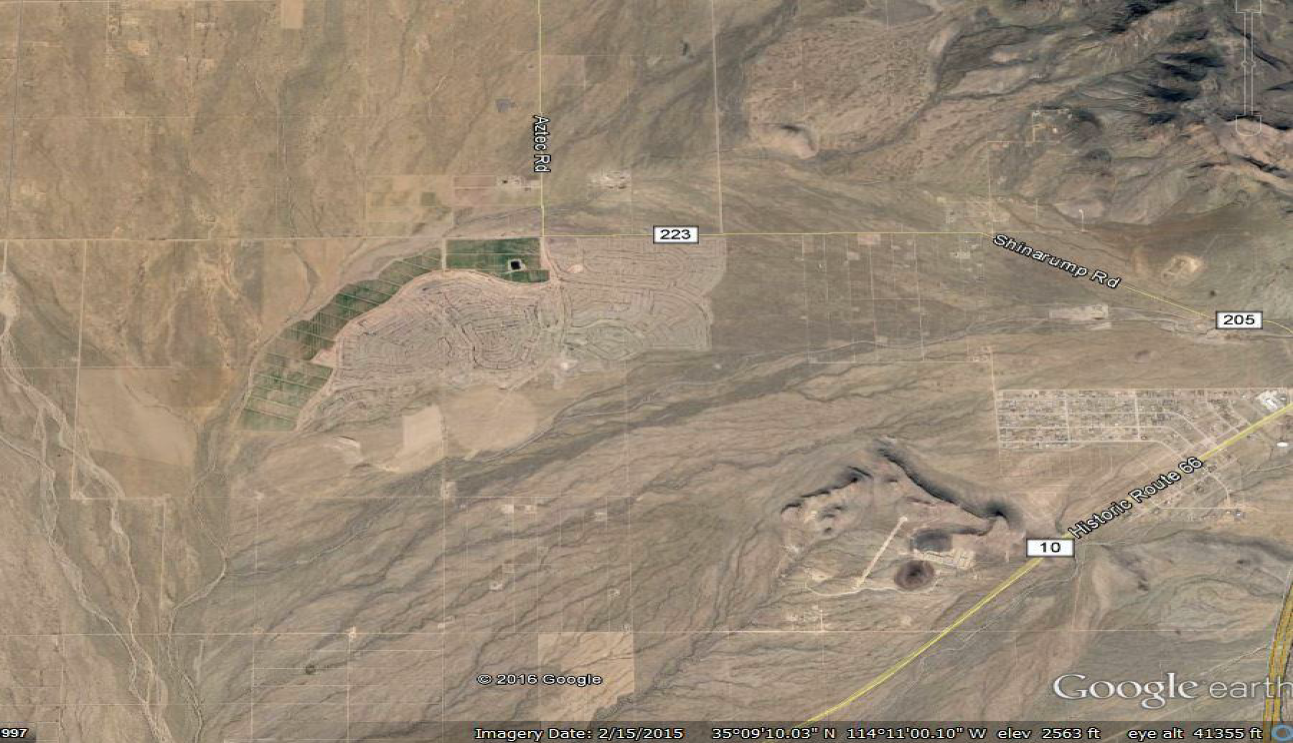
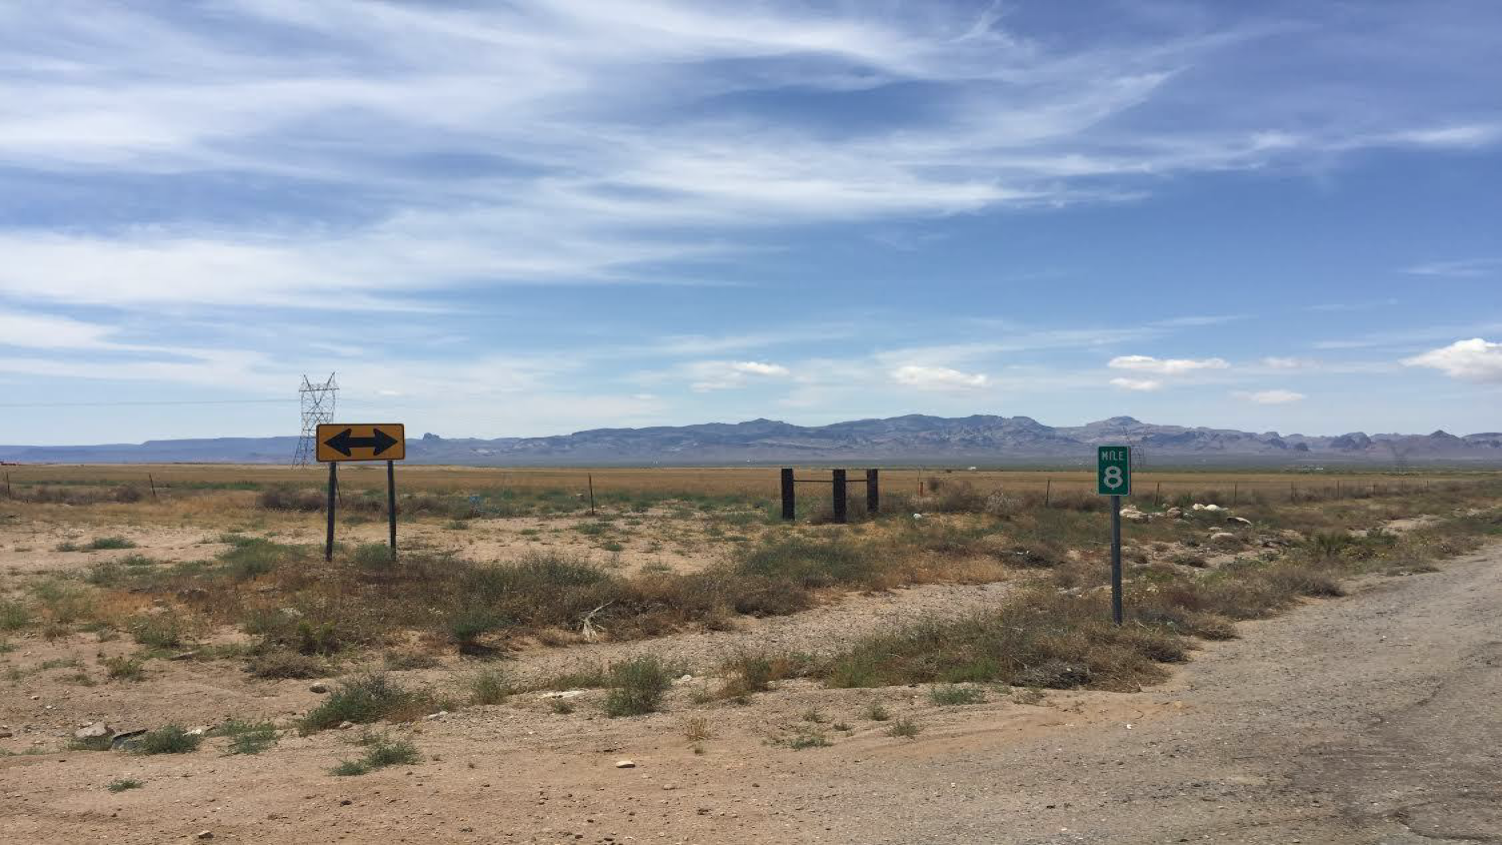
Hualapai Basin
Farming in the Long Mountain Area
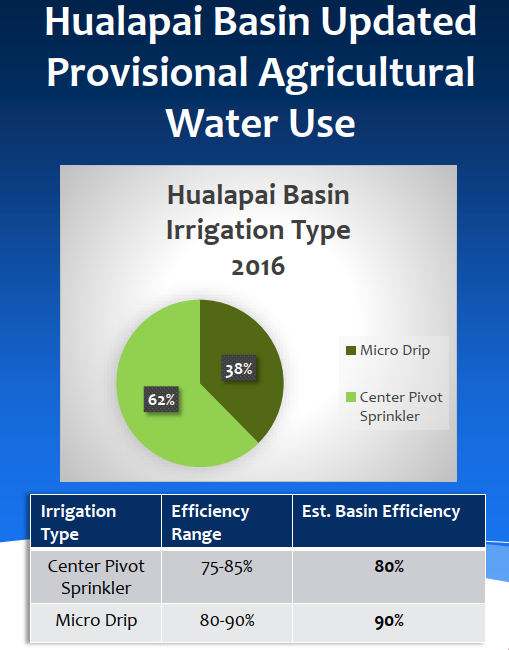

Source: U.S. Geologic Survey
*2016 Estimated Water Withdrawal Data is considered provisional
All water demand values in acre-feet
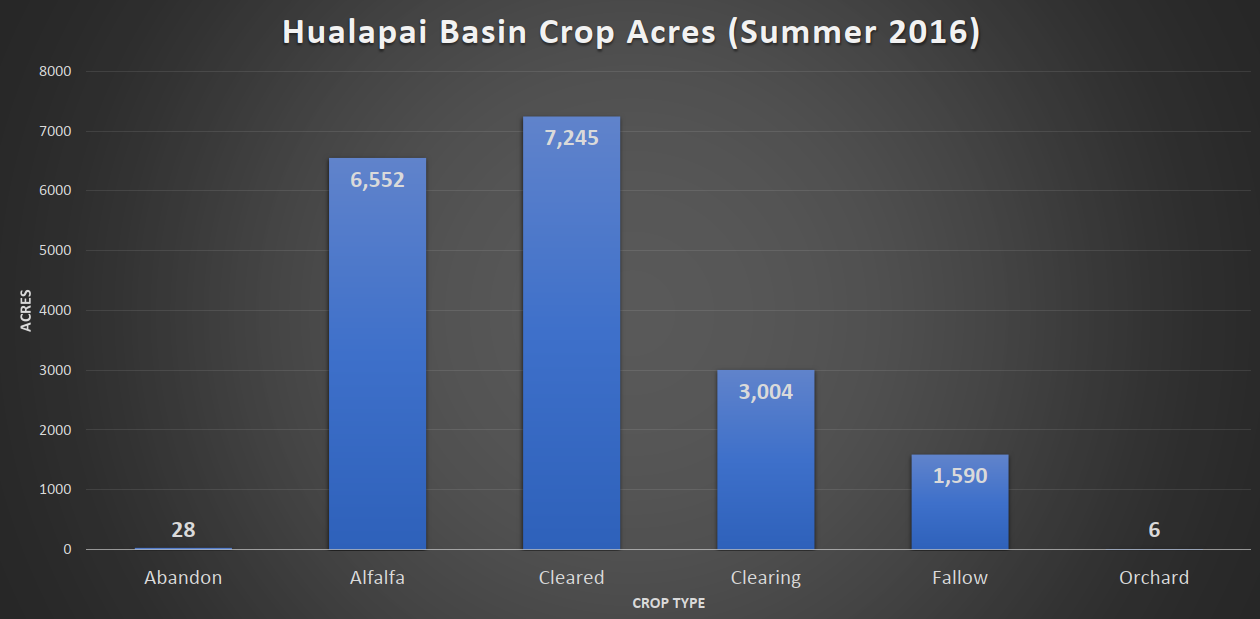
2016 Hualapai Groundwater Basin Analysis of Crop acreage distribution by season
| Crop Type | Fall Acres | Summer Acres | Spring Acres | Winter Acres |
| Abandon | 0 | 28 | 0 | 0 |
| Alfalfa | 0 | 6552 | 1695 | 1325 |
| Cleared | 0 | 7245 | 0 | 0 |
| Clearing | 0 | 3004 | 0 | 0 |
| Fallow | 1695 | 1590 | 0 | 370 |
| Orchard | 150 | 6 | 0 | 0 |
| Total | 1875 | 18425 | 1695 | 1695 |
Source: U.S. Geologic Survey
*2016 Estimated Water Withdrawal Data is considered provisional
All water demand values in acre-feet
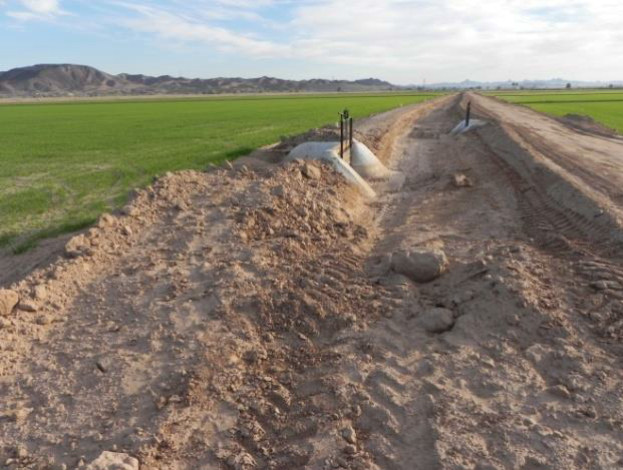
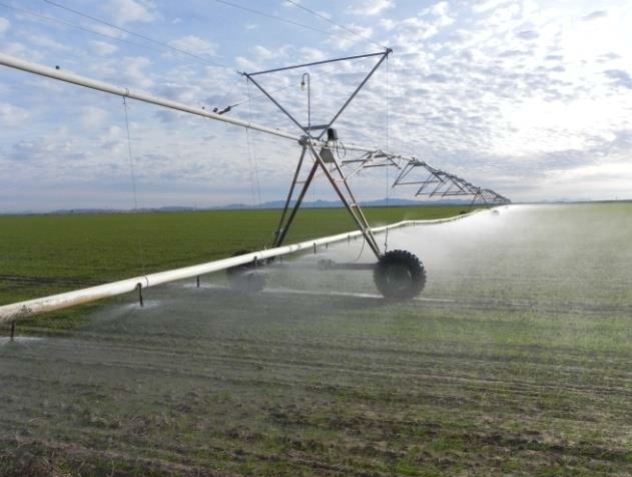
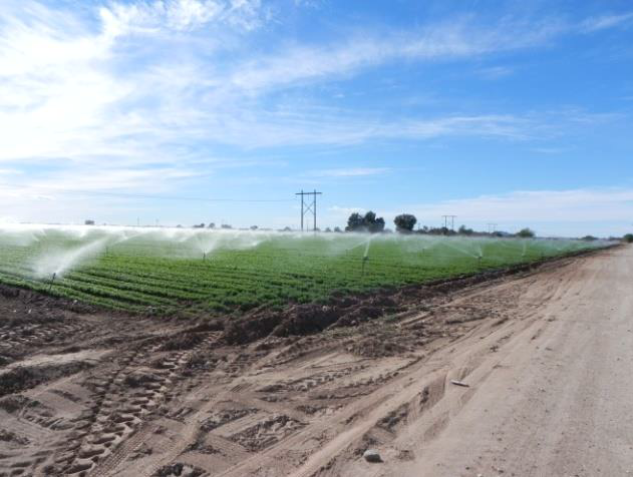
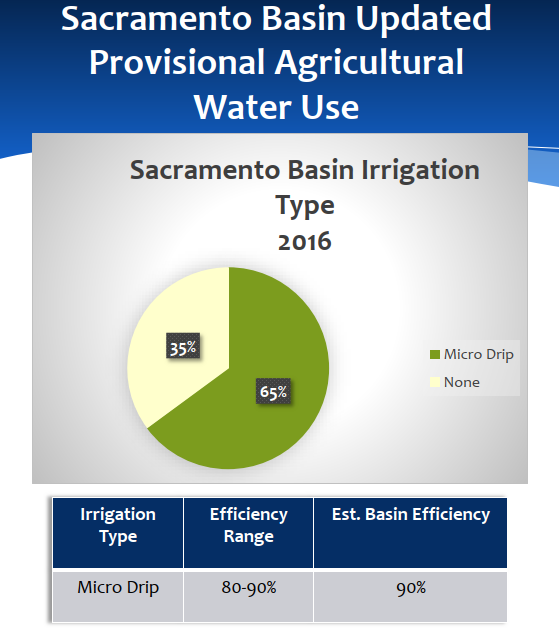
Sacramento Basin
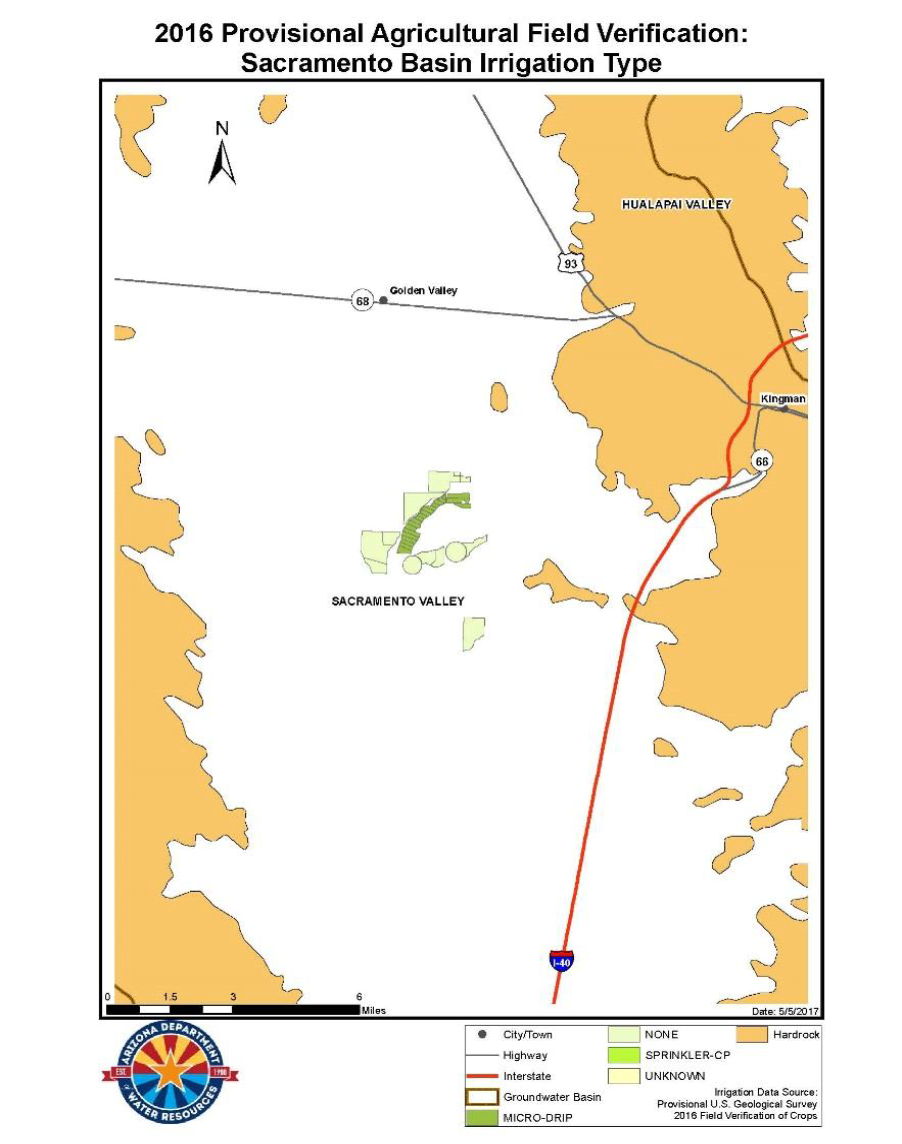
Source: U.S. Geologic Survey
*2016 Estimated Water Withdrawal Data is considered provisional
All water demand values in acre-feet
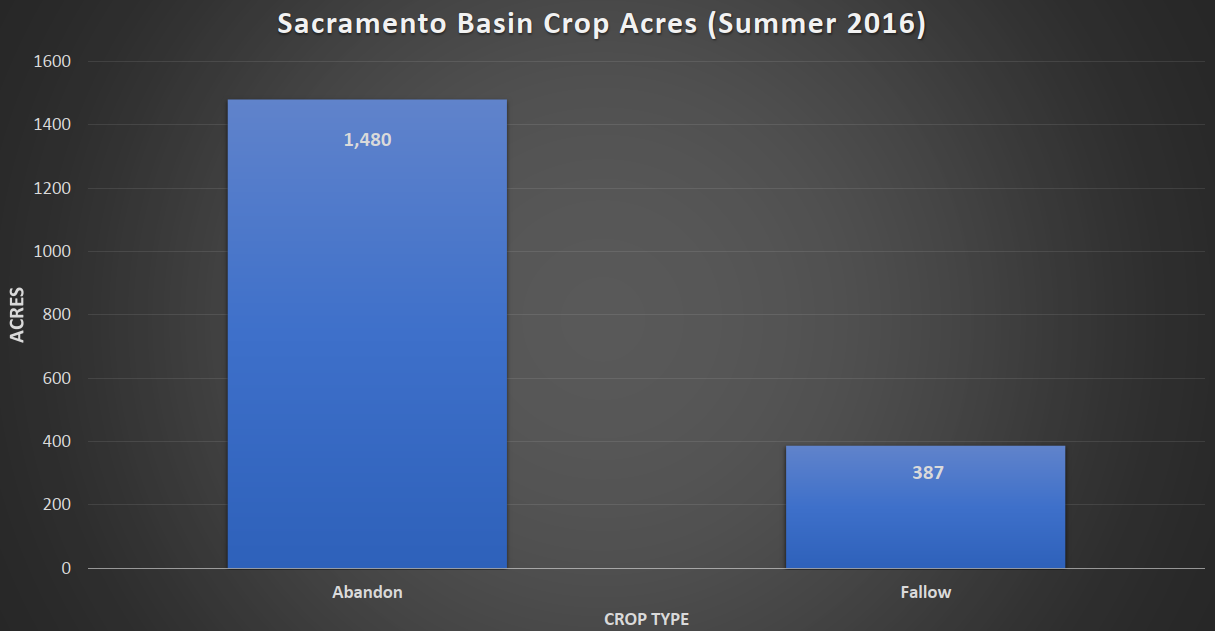
2016 Sacramento Groundwater Basin Analysis of Crop acreage distribution by season
| Crop Type | Fall Acres | Summer Acres | Spring Acres | Winter Acres |
| Abandon | 0 | 1480 | 0 | 0 |
| Alfalfa | 0 | 0 | 387 | 387 |
| Cleared | 0 | 0 | 0 | 0 |
| Clearing | 0 | 0 | 0 | 0 |
| Fallow | 387 | 387 | 0 | 0 |
| Orchard | 0 | 0 | 0 | 0 |
| Total | 387 | 1867 | 387 | 387 |
Source: U.S. Geologic Survey
*2016 Estimated Water Withdrawal Data is considered provisional
All water demand values in acre-feet
Northwest Basins Planning Area Updated Estimated Water Demands with Comparative Past Data
| Provisional Northwest Basins Planning Area Estimated Water Demand Update | ||
| Water Use Sector | Year | Estimated Water Demand (acre-feet) |
| Municipal Water Demand | 2016 | 11,189 |
| Industrial Water Demand | 2016 | 6,833 |
| *Agricultural Water Demand | 2016 | 32,460 |
| 50,482 | ||
Updated 5-16-2017
*Agricultural Water Demand Provisional 2016 USGS Estimated Data
All 2016 Northwest Basins Planning Area water demand estimates are provisional and subject to change
All Water demands are in acre-feet
| Strategic Vision Northwest Basins Water Demands | ||
| Water Use Sector | Year | Estimated Water Demand (acre-feet) |
| Municipal Water Demand | 2010 | 12,782 |
| Industrial Water Demand | 2010 | 1,475 |
| *Agricultural Water Demand | 2010 | 0 |
| 14,257 | ||
All Water demands are in acre-feet
Source: A Strategic Vision for Water Supply Sustainability January 2014, ADWR. Table P.A. 15-1 Projected Demands-Northwest Basins Planning Area. Page P.A. 15-4